The Lower Mainland Real Estate Market Reports, Forecasts and Trends


Hello Friends, It’s Bill Coughlin! 

Have these Market Reports helped you?

💰 I’ve spent over $500,000 and 42 years creating the most accurate Real Estate Forecasts for Fraser Valley & Vancouver!

✅ If you find value in these reports — TEXT ME to let me know you want them to continue! 

❓Need help understanding what this means for your property?
📞 Call me for your Free Market Analysis of your home.

📲 Text me now at 778-374-3744. I’m here to help put More Money in Your Pocket!


The lower mainland real estate market reports give you live market updates. Pick a city above for their report!!  
See the 2-week update 

                         EXPAND..Interactive Link


Hello Friends, It’s Bill Coughlin! 

Have these Market Reports helped you?

💰 I’ve spent over $500,000 and 42 years creating the most accurate Real Estate Forecasts for Fraser Valley & Vancouver!

✅ If you find value in these reports — TEXT ME to let me know you want them to continue! 

❓Need help understanding what this means for your property?
📞 Call me for your Free Market Analysis of your home.

📲 Text me now at 778-374-3744. I’m here to help put More Money in Your Pocket!


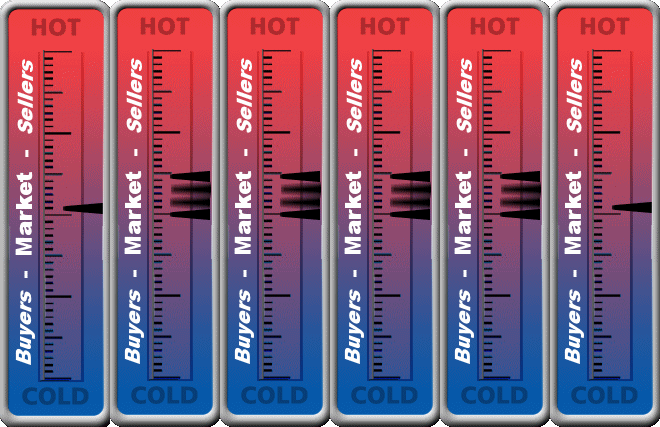
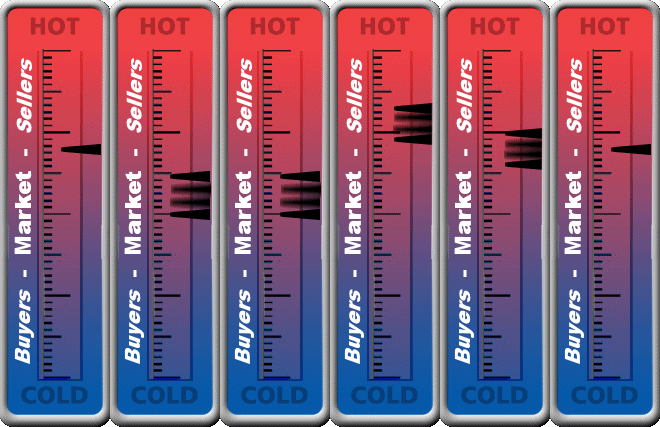
gas gauge

Vancouver Area  Oct. 17, 2026  (2-week update)

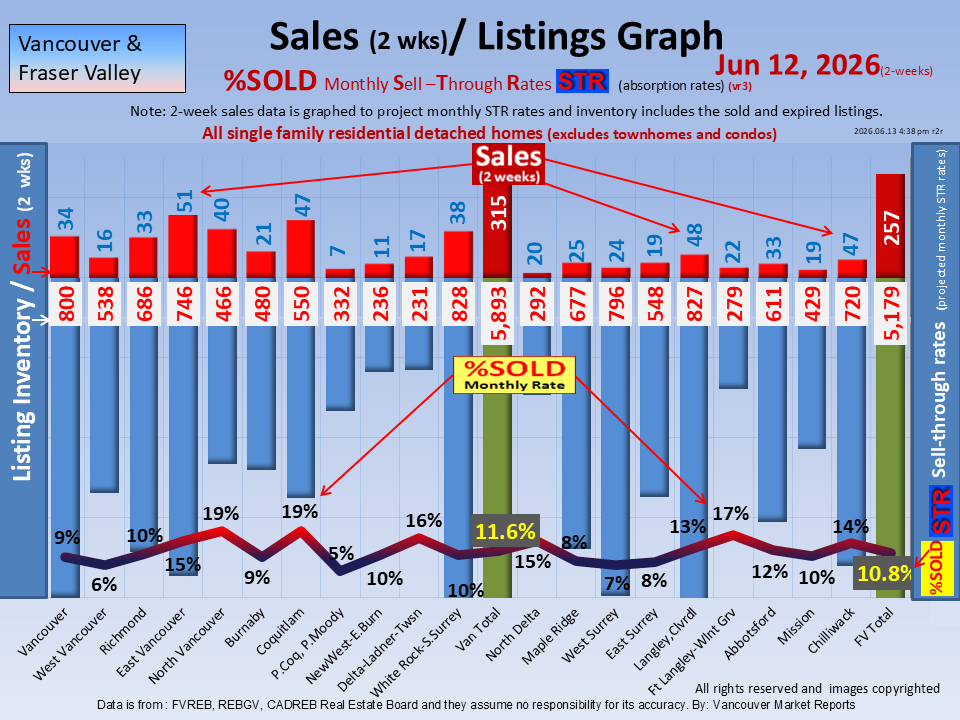
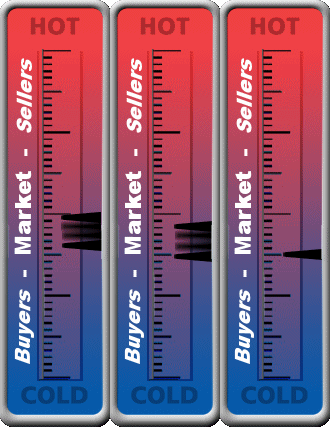
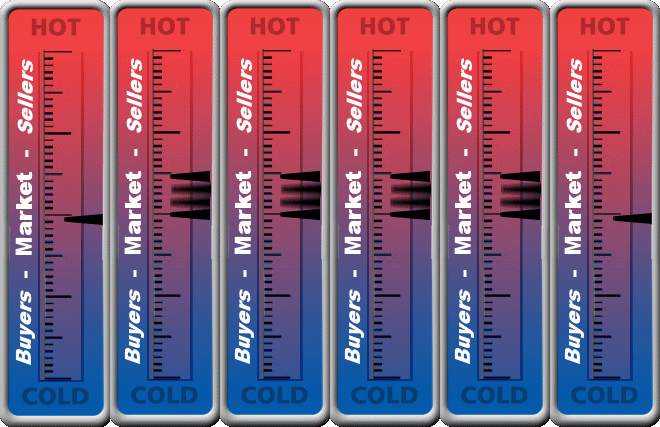
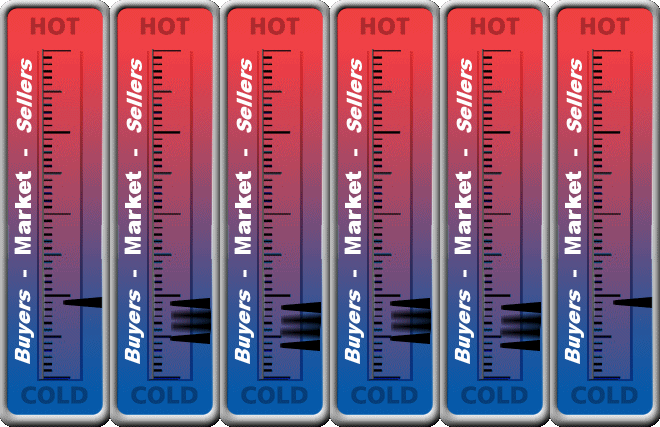
Current:  Vancouver area Real Estate Market is in Buyer's Market with an average of 9.7% SOLD rate.   See each city for the full details.

Forecast:

Greater Vancouver September 2026: 

Home Prices Are Still Falling! But There’s Some Good News!

Greater Vancouver detached home prices dropped an average of $16,504 in September, compared to $22,911 in August. That's a 28% smaller drop! However, 81% of detached home markets are still declining. Condo prices fell $4,797, with 78% of markets dropping. Townhomes took an even bigger hit, falling an average of $8,593, with 87% of markets declining! Canadian consumer confidence is extremely weak. American tariffs are forcing Canadian businesses to close, lay off staff, or move south. We forecast more job losses next month = more downward pressure on home prices! But this market could turn around! If Canada & the US reach a trade agreement with lower tariffs, businesses could regain confidence & start hiring again. If interest rates dropped 1.5%, banks made financing easier & governments offered buyer incentives, sales could recover! EG: FOR 6 MONTHS, remove GST on new homes & property transfer taxes on all sales. This would encourage buyers to step back into the market! Bottom Line: Restore jobs, lower interest rates & reduce buying costs = more buyers, more sales & a stronger housing market!

Want to know how your neighbourhood is performing? Visit VancouverMarketReports.com every Saturday at noon for the latest Sell-Through Rates across all 17 cities. For expert advice or a free home market review, call Bill Coughlin and the Coughlin Team at 778-374-3744. We’re here to help you understand the market and make the best move.


Fraser Valley September 2026: 

Good News! Detached Home Prices Are Falling Slower!

Fraser Valley detached home prices dropped an average of $5,589, compared to $10,687 in August. However, 56% of detached markets are still declining. Condos fell $3,717, with 83% of markets declining. Townhomes took the biggest hit, dropping $9,208, with 92% of markets falling! Bottom Line: Detached homes are showing improvement, but condos & townhomes remain under pressure. Buyers have stronger bargaining power! Sellers need competitive prices to attract serious offers. Canadian consumer confidence is extremely weak. American tariffs are forcing Canadian businesses to close, lay off staff, or move south. We forecast more job losses next month = more downward pressure on home prices! But this market could turn around! If Canada & the US reach a trade agreement with lower tariffs, businesses could regain confidence & start hiring again. If interest rates dropped 1.5%, banks made financing easier & governments offered buyer incentives, sales could recover! EG: FOR 6 MONTHS, remove GST on new homes & property transfer taxes on all sales. This would encourage buyers to step back into the market! Bottom Line: Restore jobs, lower interest rates & reduce buying costs = more buyers, more sales & a stronger housing market!

Want to know how your neighbourhood is performing? Visit VancouverMarketReports.com every Saturday at noon for the latest Sell-Through Rates across all 17 cities. For expert advice or a free home market review, call Bill Coughlin and the Coughlin Team at 778-374-3744. We’re here to help you understand the market and make the best move.


Fraser Valley & Chilliwack  Oct. 17, 2026  (2-week update)

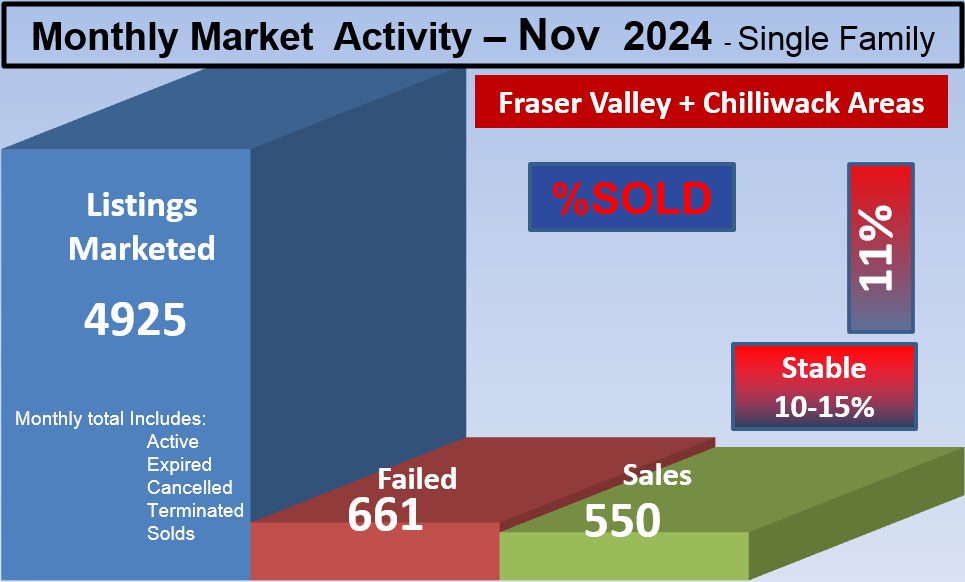
Current:  Fraser Valley and the Chilliwack areas are in a Stable Market averaging a 9.8% SOLD rate.  See each city link for the full details

gas gauge

by Vancouver Market Reports 

Vancouver Area Real Estate Market Investment Conditions - Monthly Overview

Hello Friends, It’s Bill Coughlin! 

Have these Market Reports helped you?

💰 I’ve spent over $500,000 and 42 years creating the most accurate Real Estate Forecasts for Fraser Valley & Vancouver!

✅ If you find value in these reports — TEXT ME to let me know you want them to continue! 

❓Need help understanding what this means for your property?
📞 Call me for your Free Market Analysis of your home.

📲 Text me now at 778-374-3744. I’m here to help put More Money in Your Pocket!

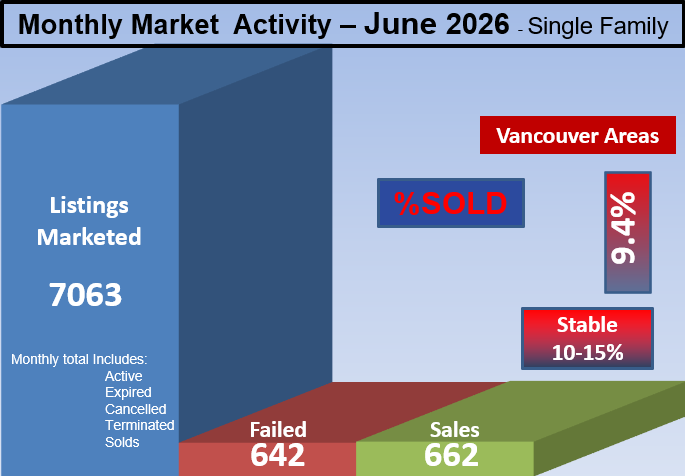
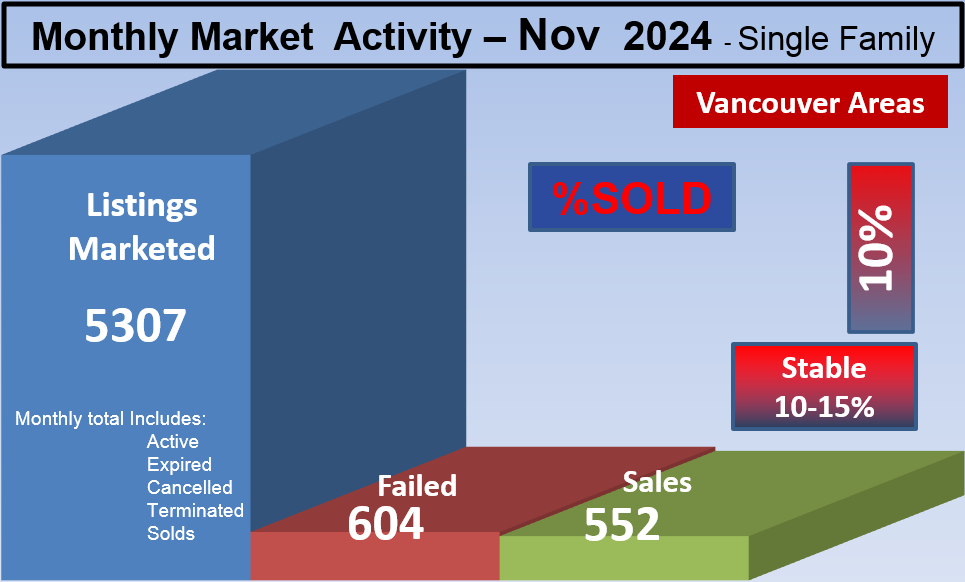
In the Vancouver area for the Month of March 2026, 19% of the Single Family Home Sold Listings reduced their List Price by an average of $116,540. This compared to February 2026 when 19% reduced their List Price by an average of $124,310.
(Note: the other Two Week Reports ( STR and MTI ) will be more accurate market indicators than this monthly report after the middle of each month)


Fraser Valley & Chilliwack Area Real Estate Investment Market Conditions - Monthly Overview

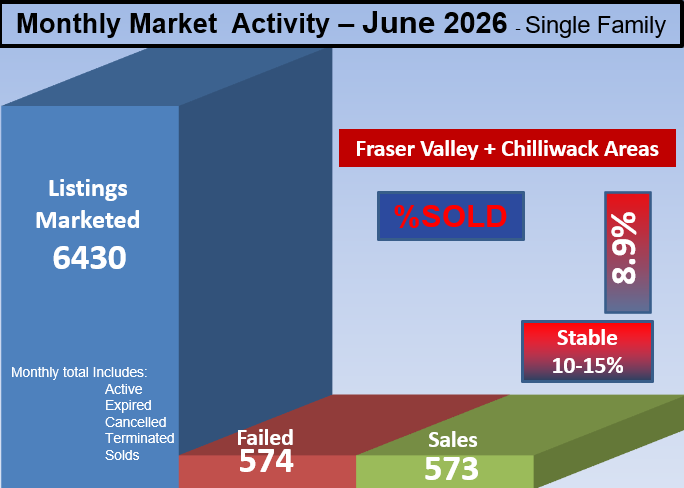
In the Fraser Valley-Chilliwack area, for the Month of March 2026, 27% of the Single Family Home Sold Listings reduced their List Price by an average of $53,402. This is compared to February 2026 when 24% reduced their List Price by an average of $56,572.


   Which Real Estate Markets are Going Up or Down Next?
You can follow the Market Money move from the West to the East every 2 weeks. Need a lesson? Call 778-374-3744  
   

Trying to do the math?   STR   Lesson  MTI  Lesson


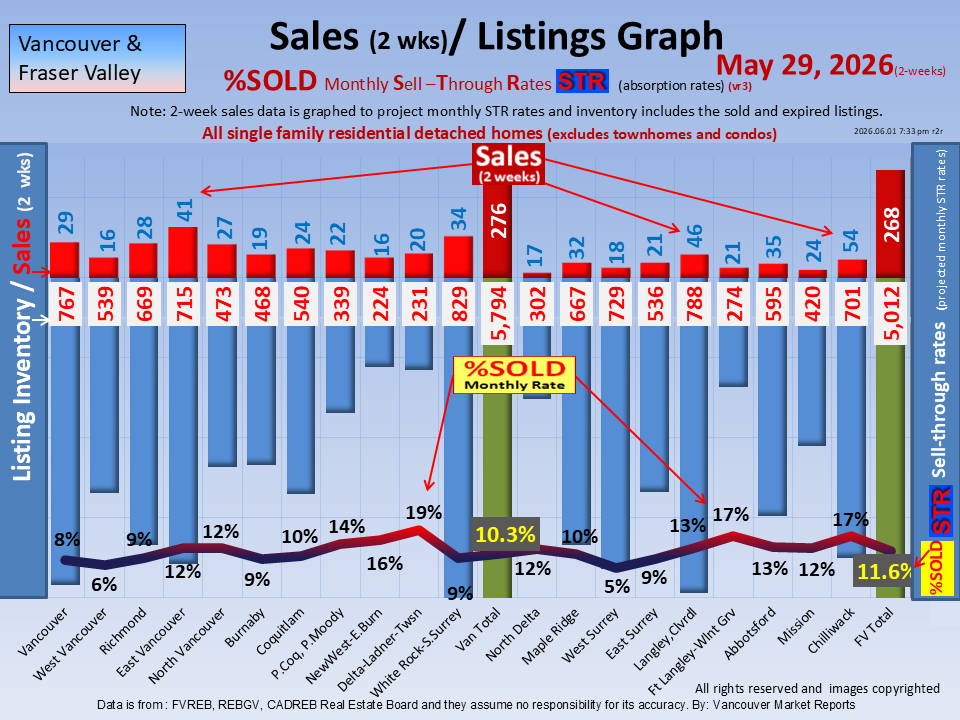
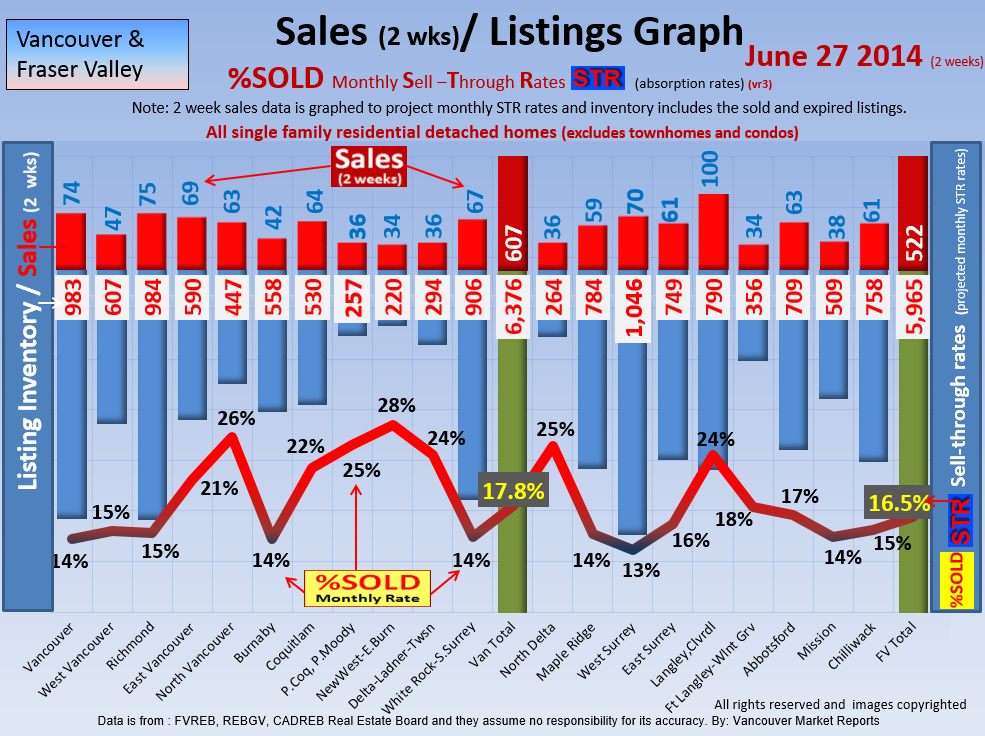
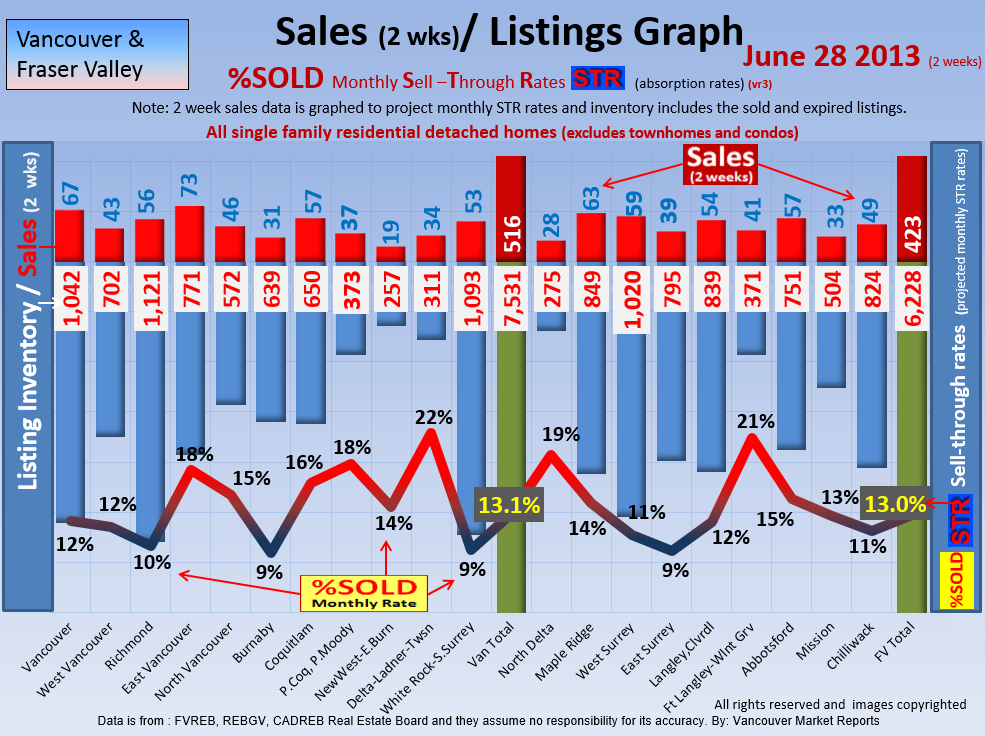
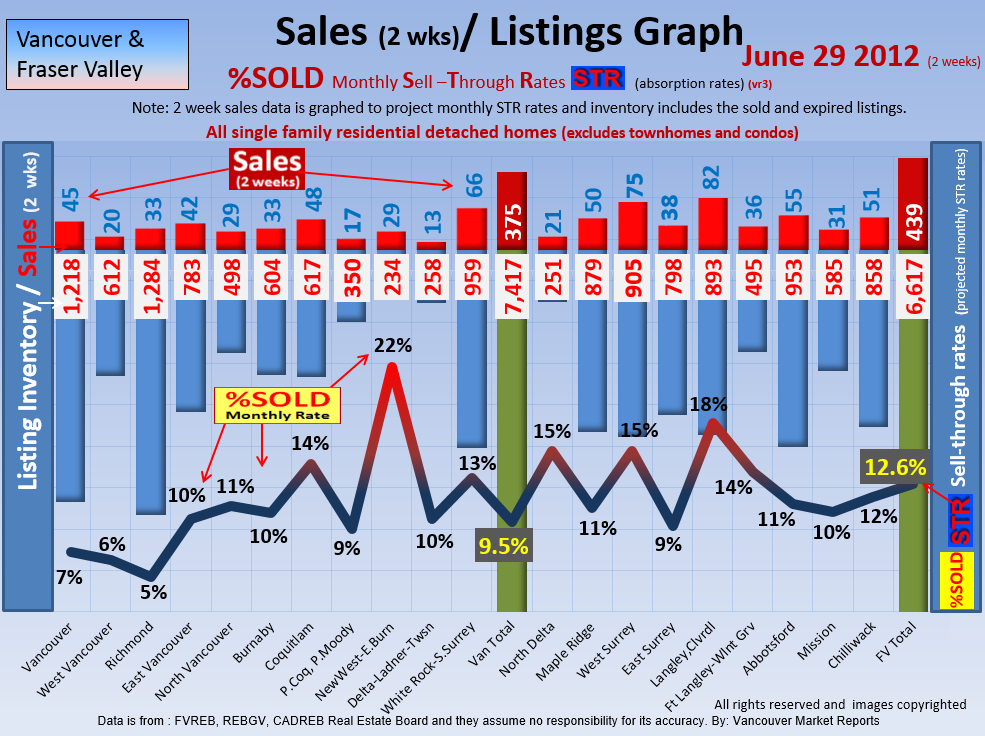
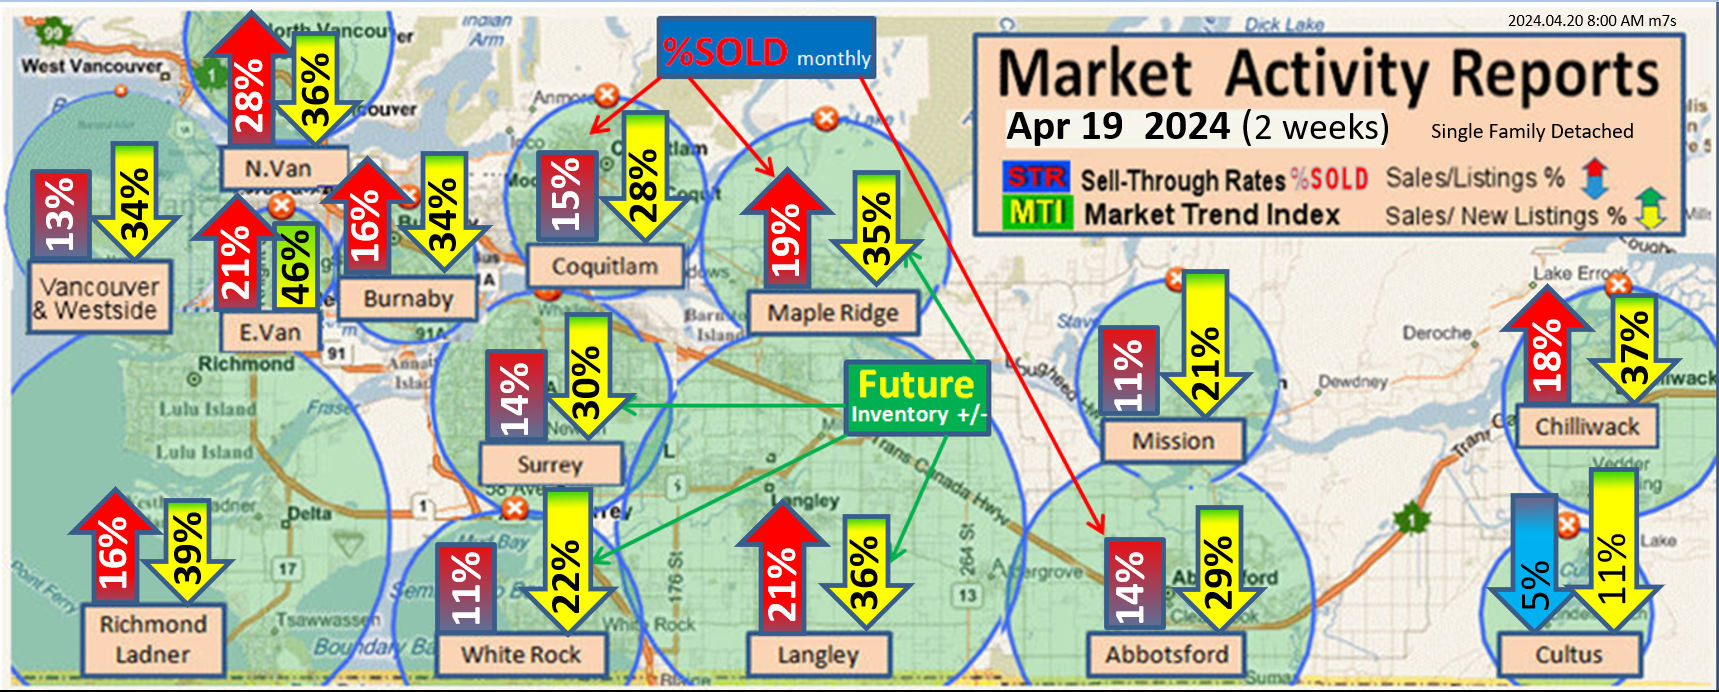
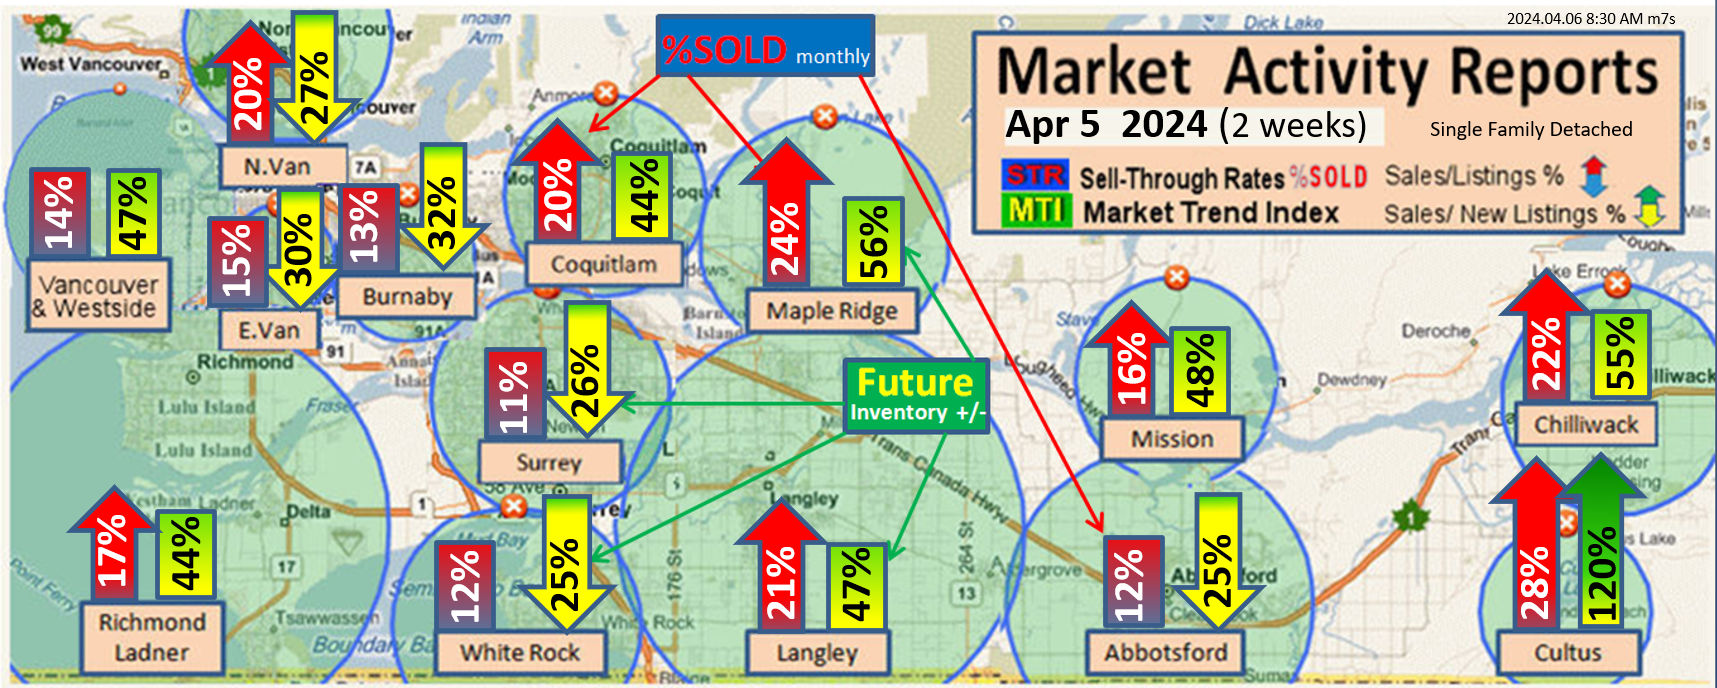
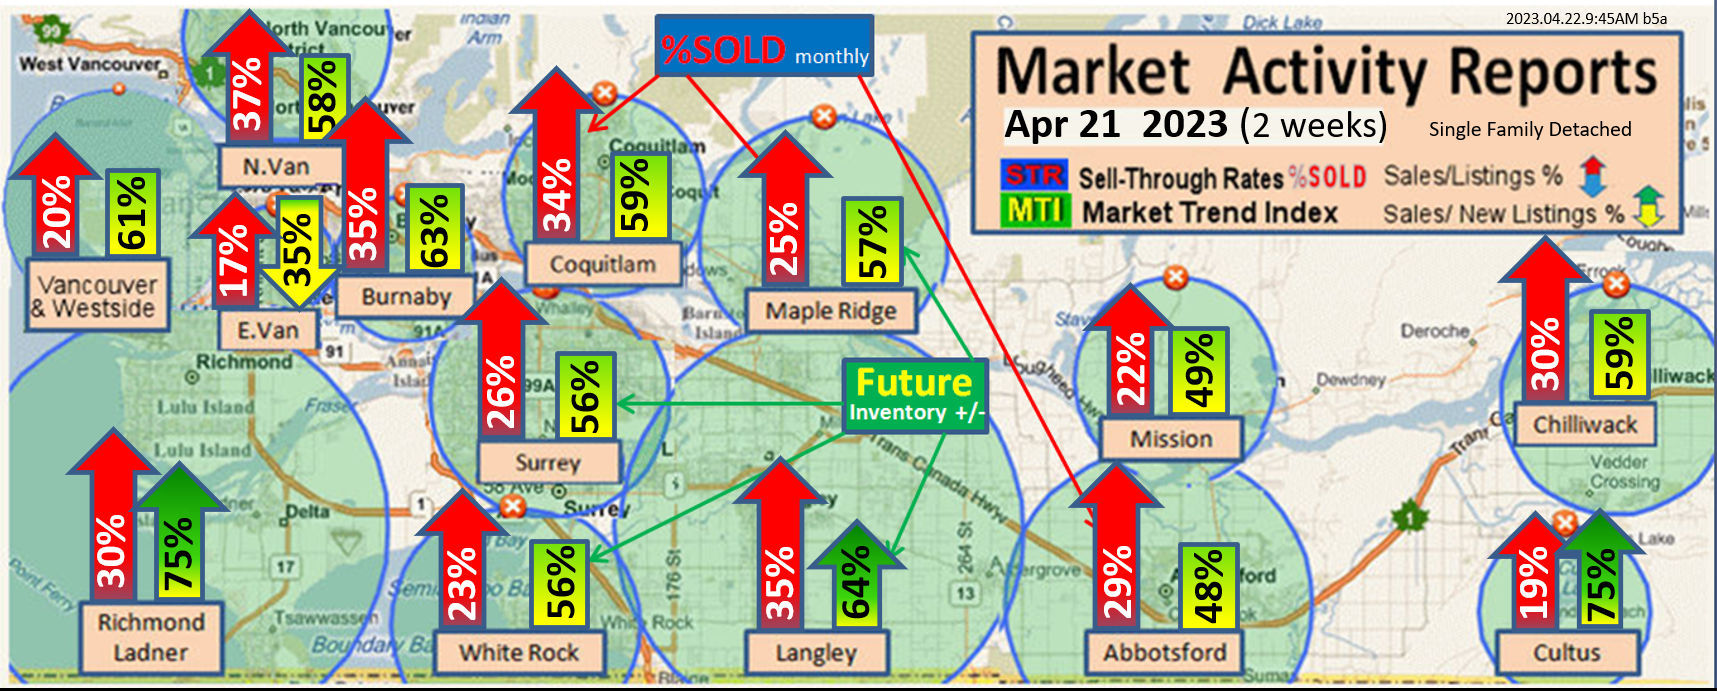
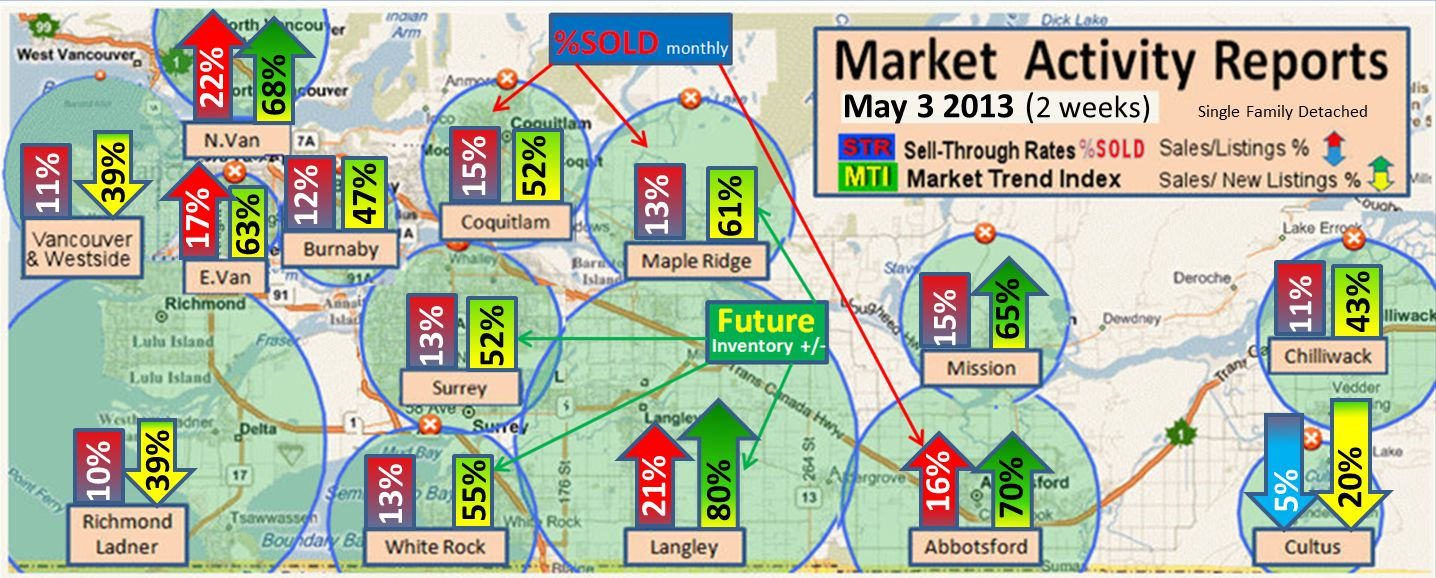
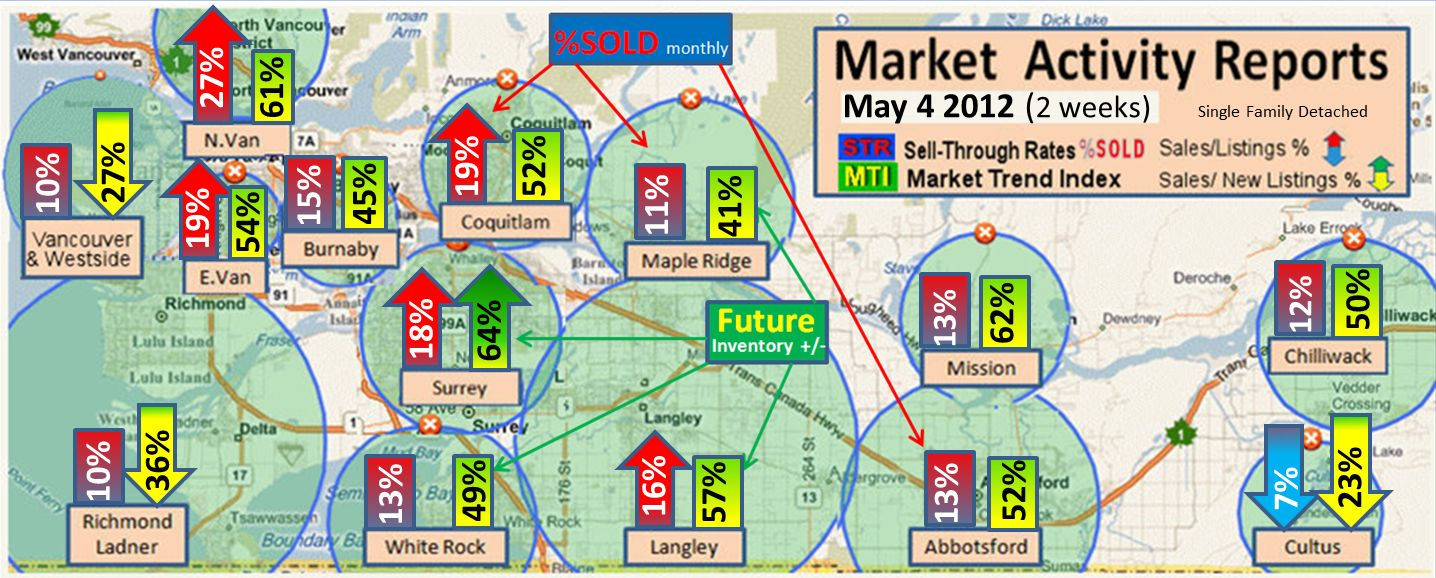
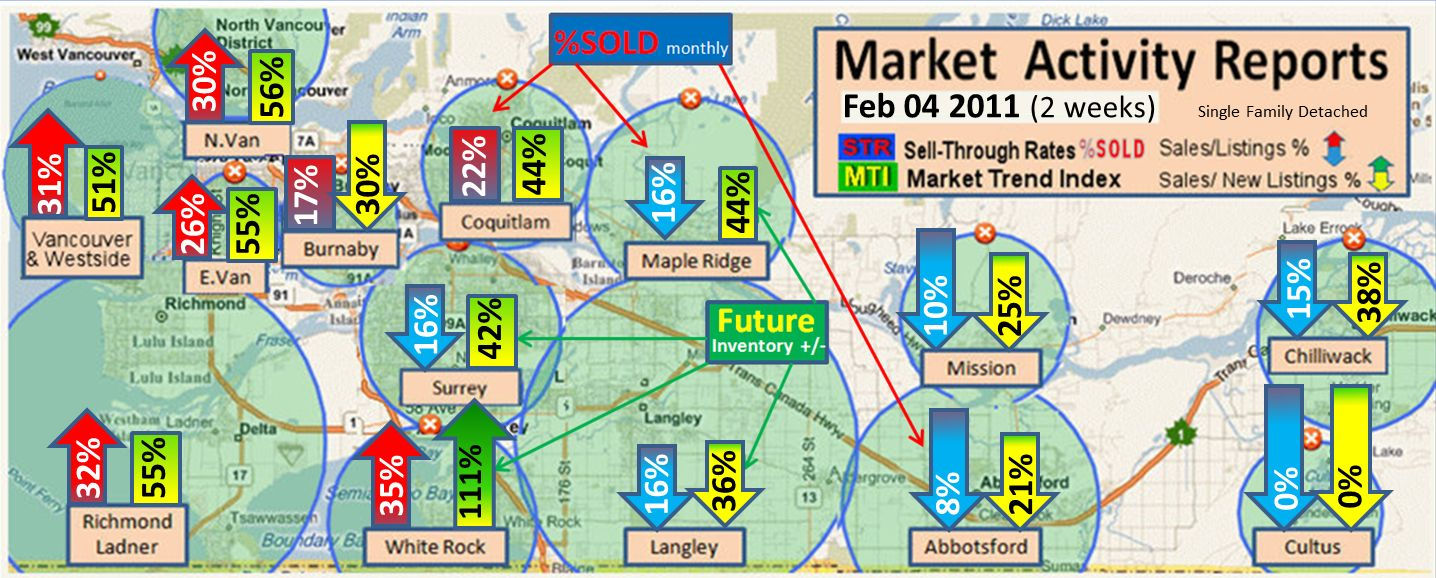
%SOLD rates for 2 Weeks below


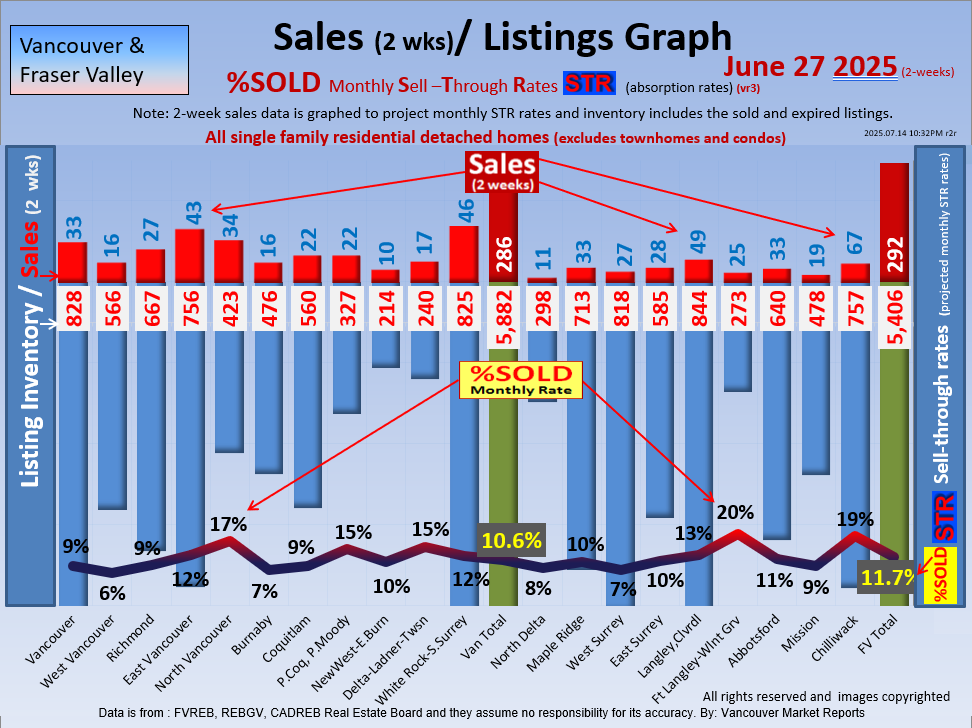
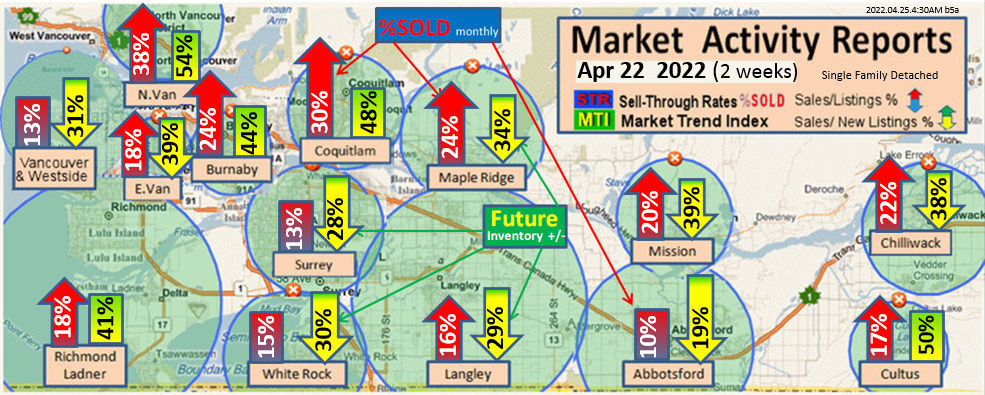
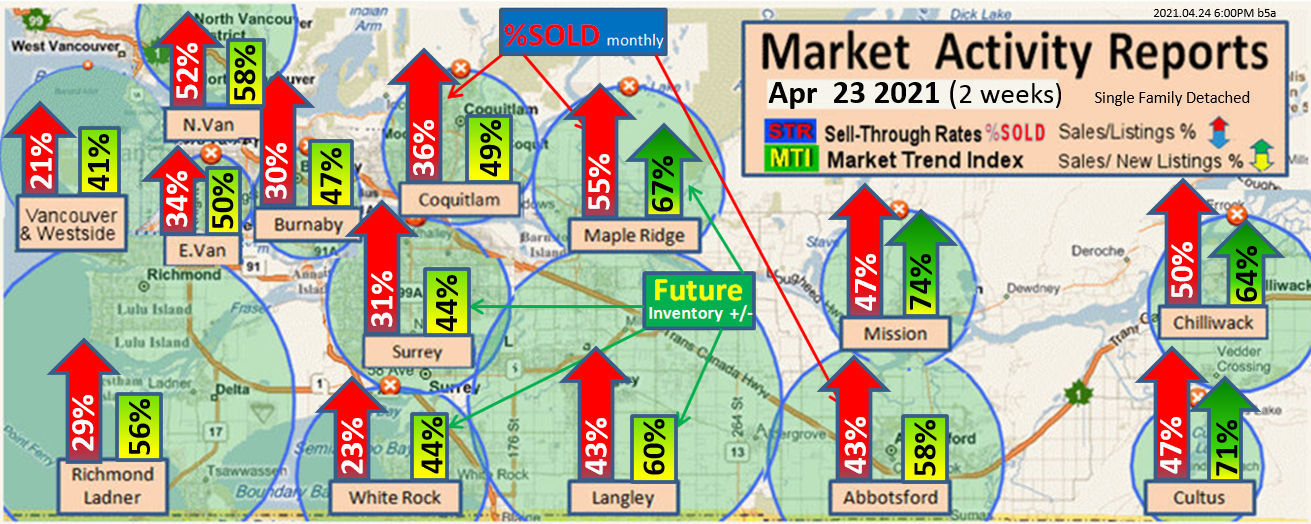
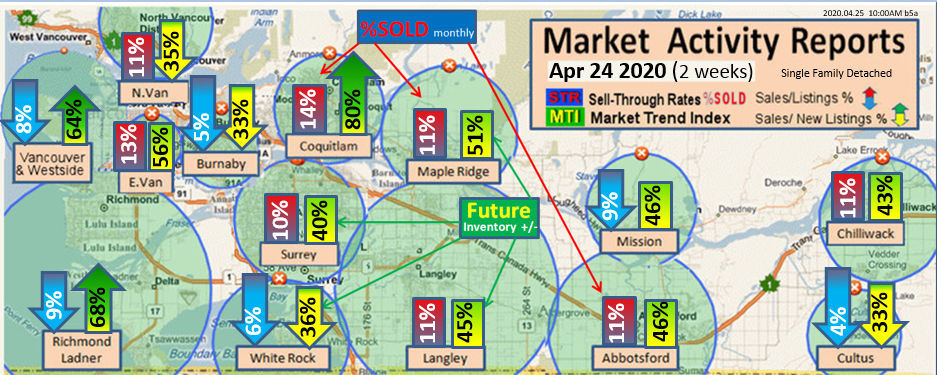
Now do compare the %SOLD rates to last year below!      Archive

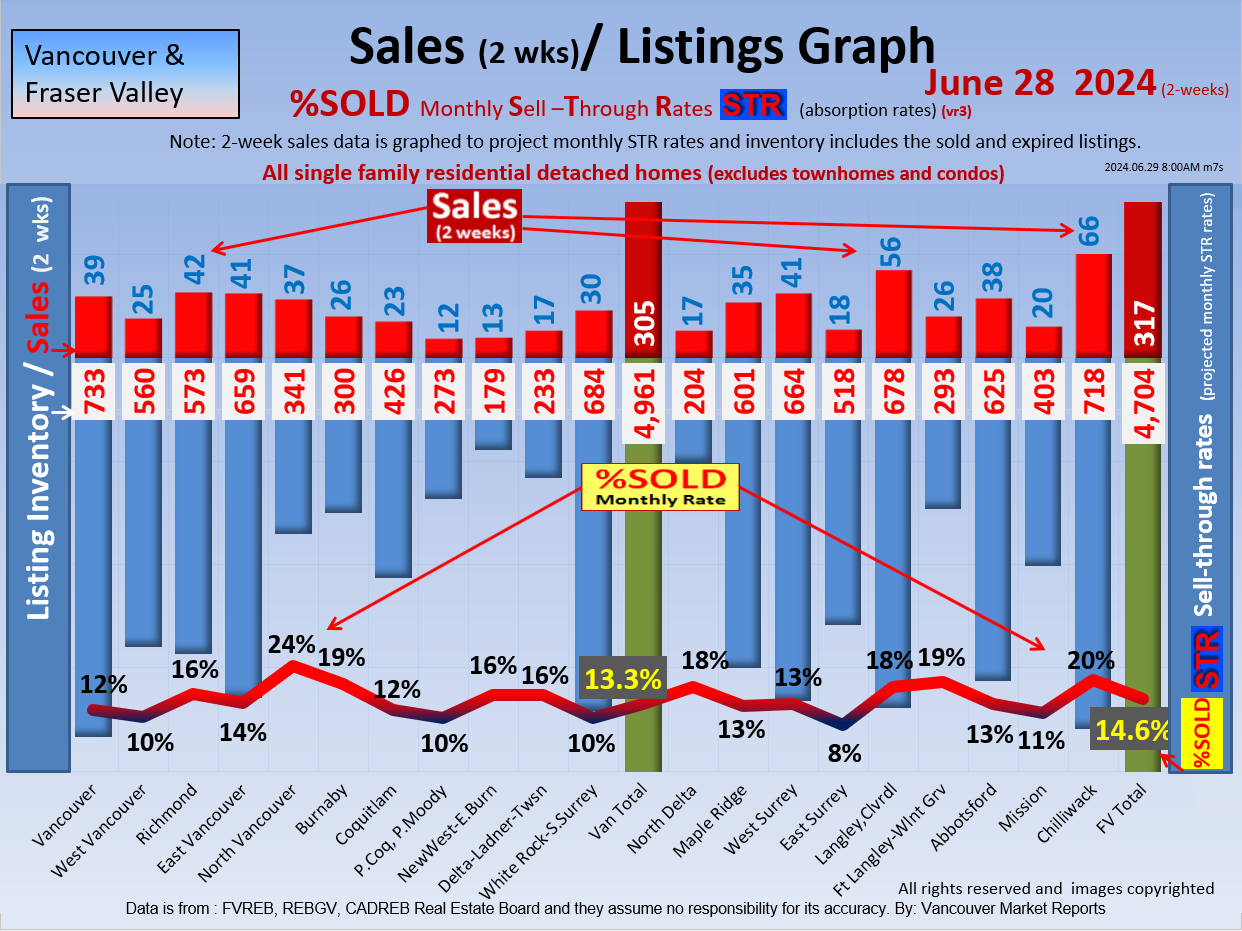
Now do compare the %SOLD rates to the year 2024

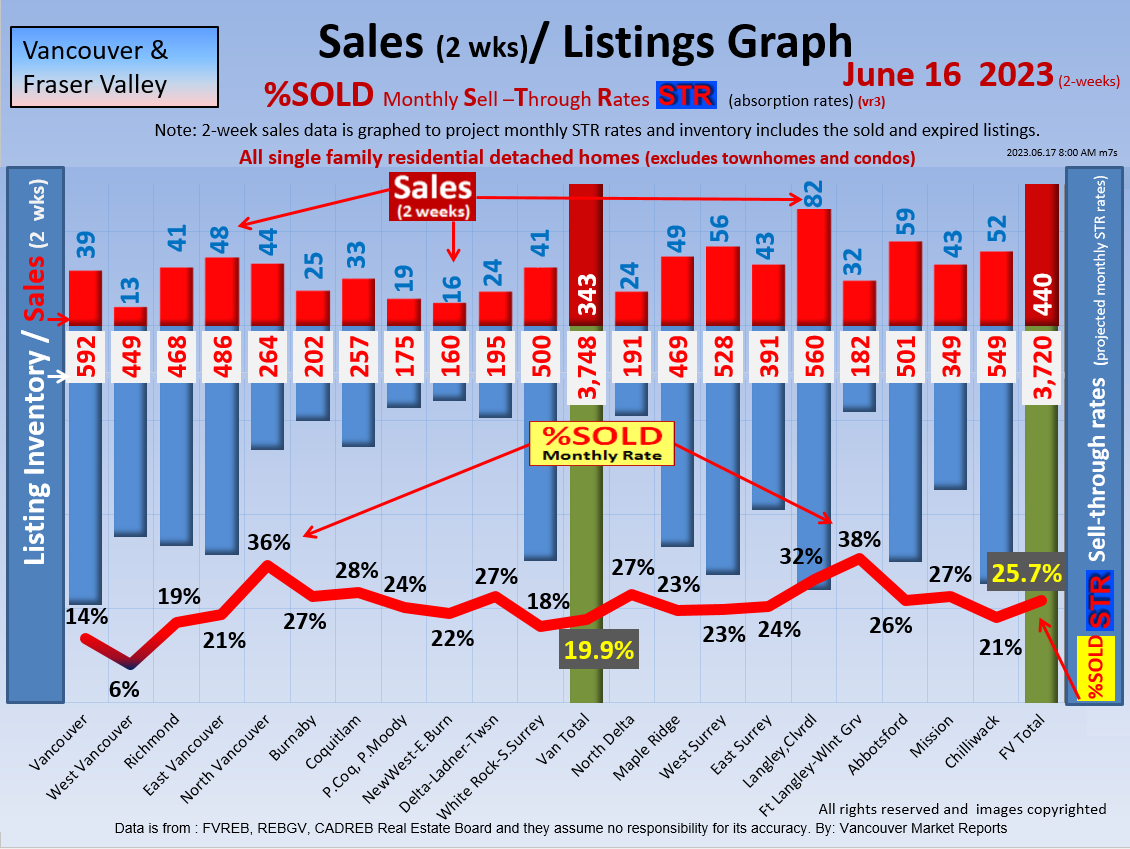
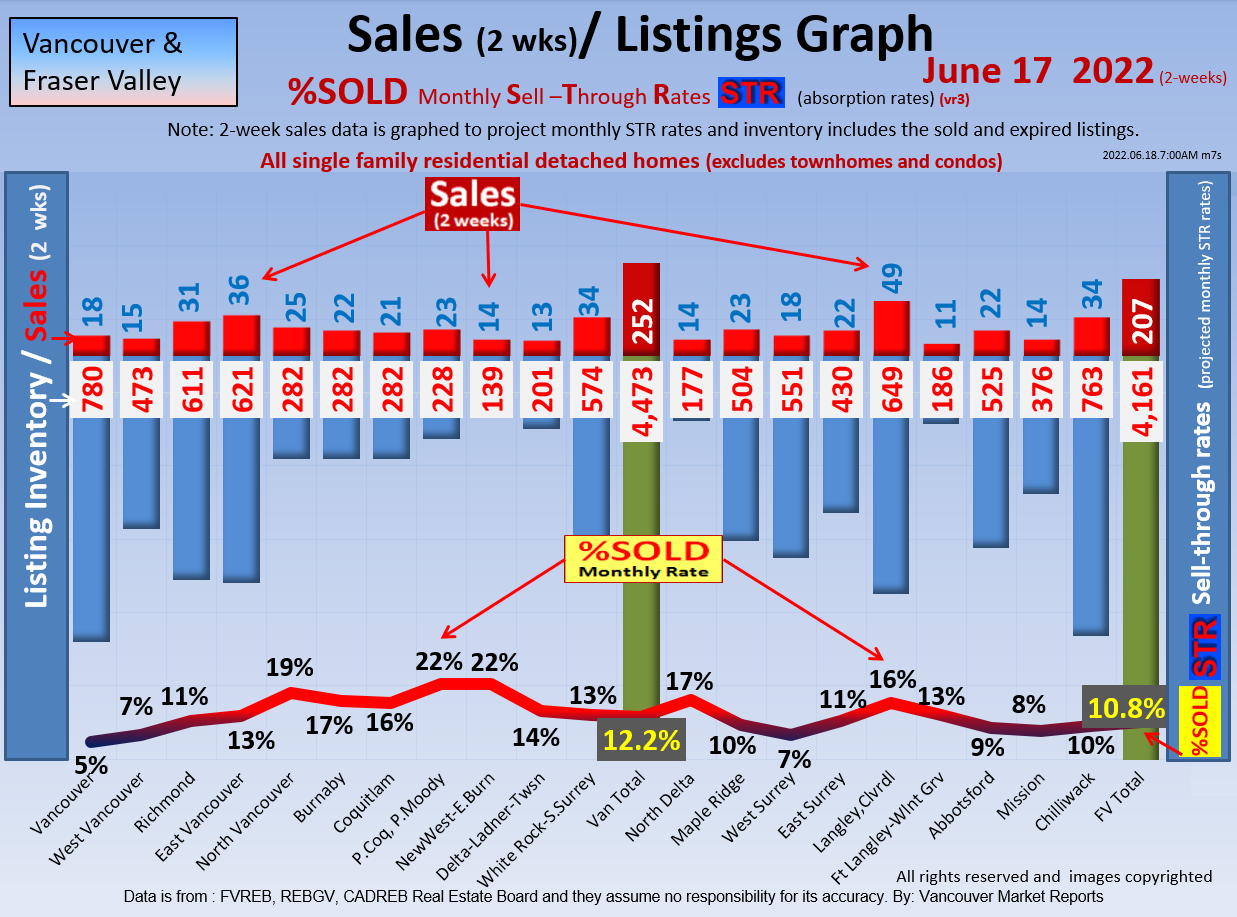
Now do compare the %SOLD rates to the year 2023Now do compare the %SOLD rates to the year 2022

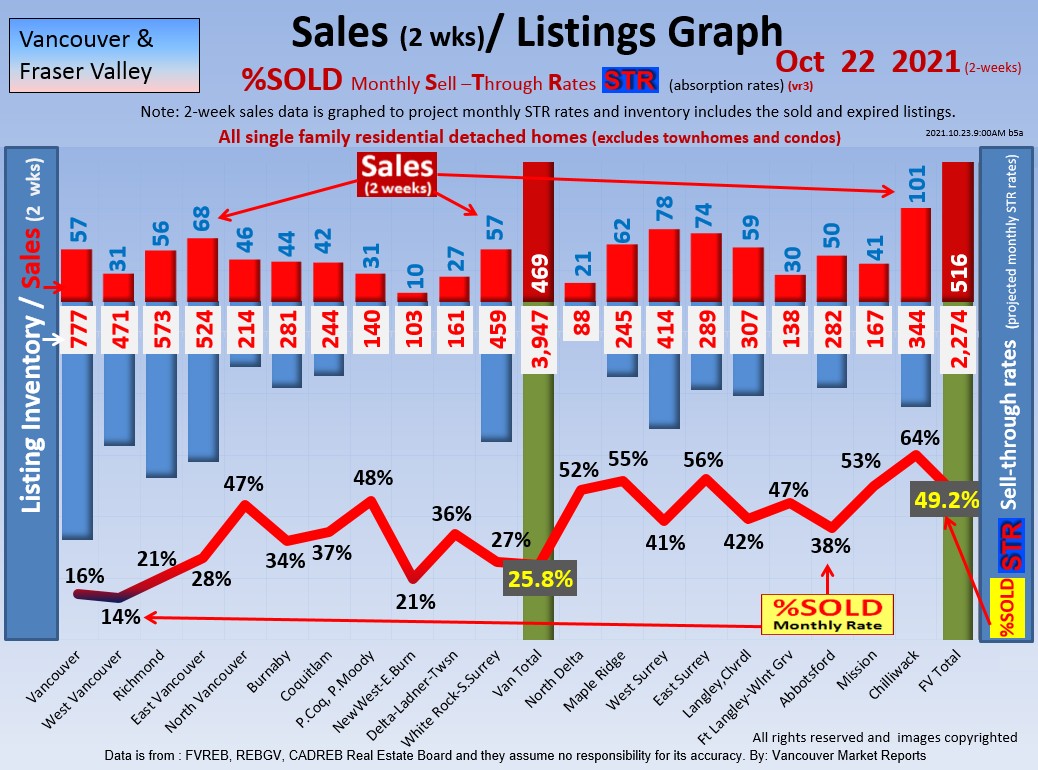
Now do compare the %SOLD rates to the year 2021

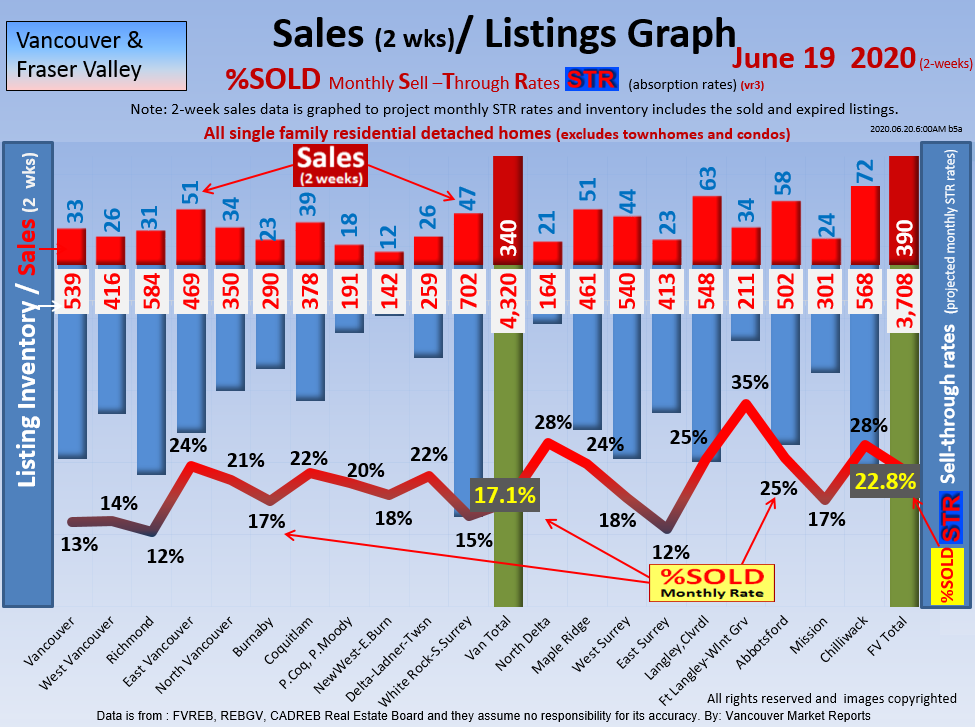
Now do compare the %SOLD rates to the year 2020

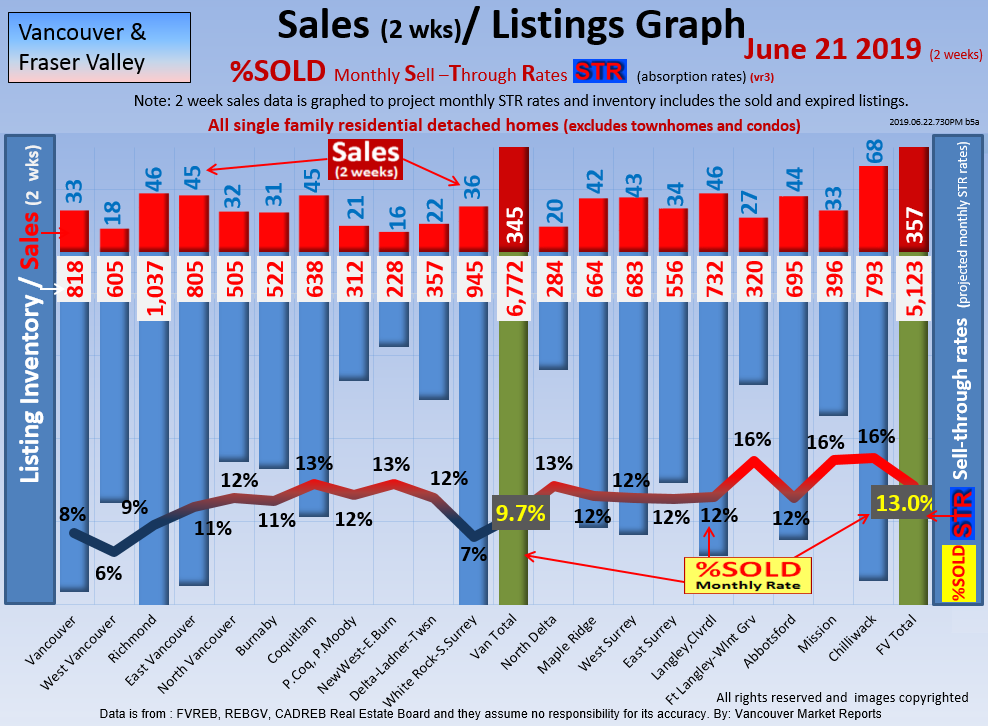
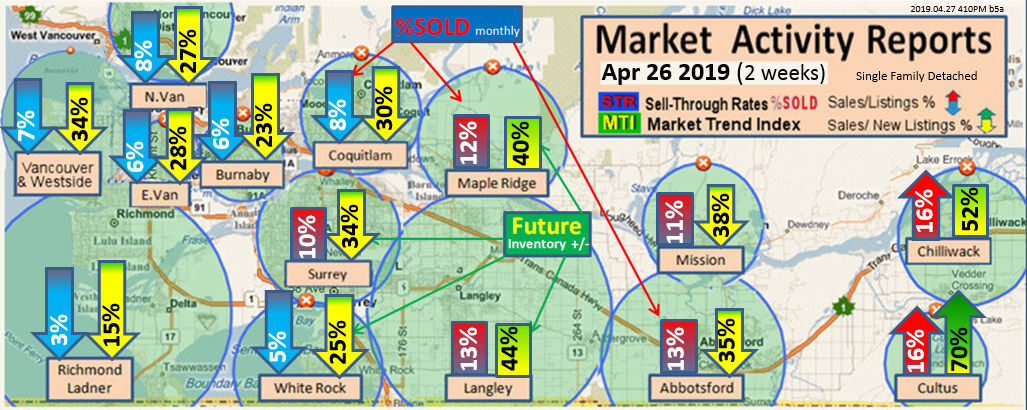
Now do compare the %SOLD rates to the year 2019

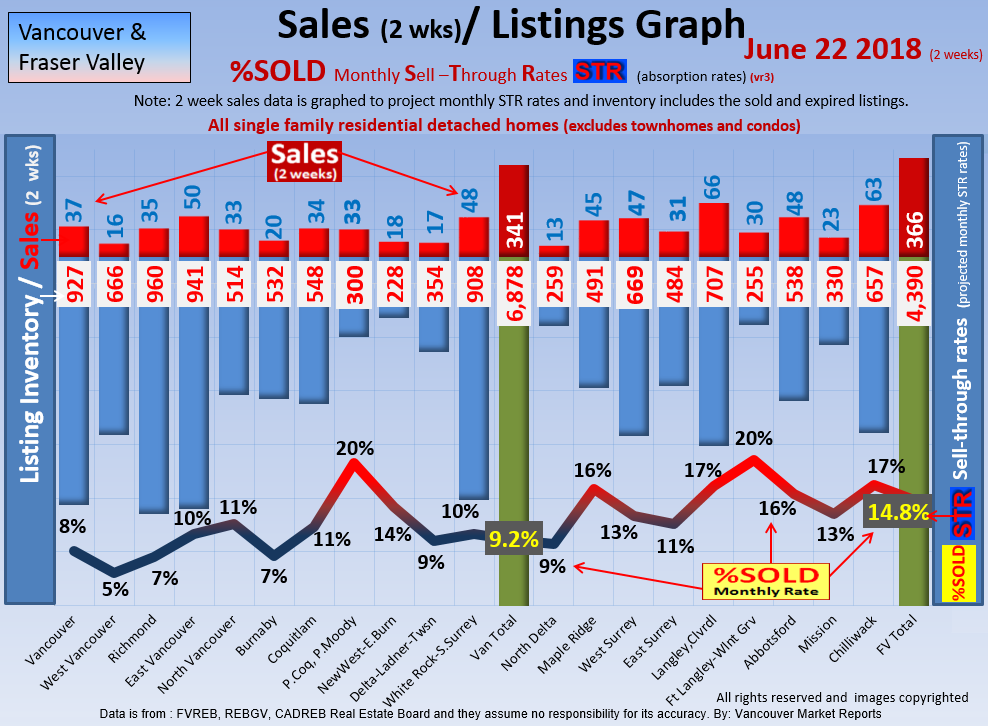
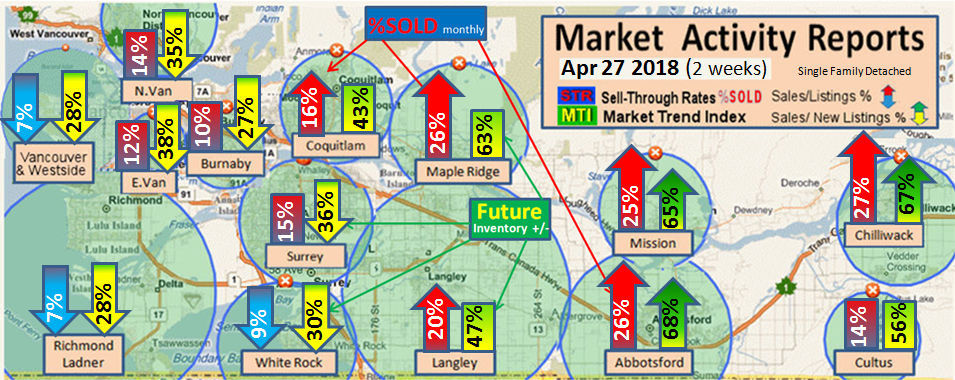
Now do compare the %SOLD rates to the year 2018

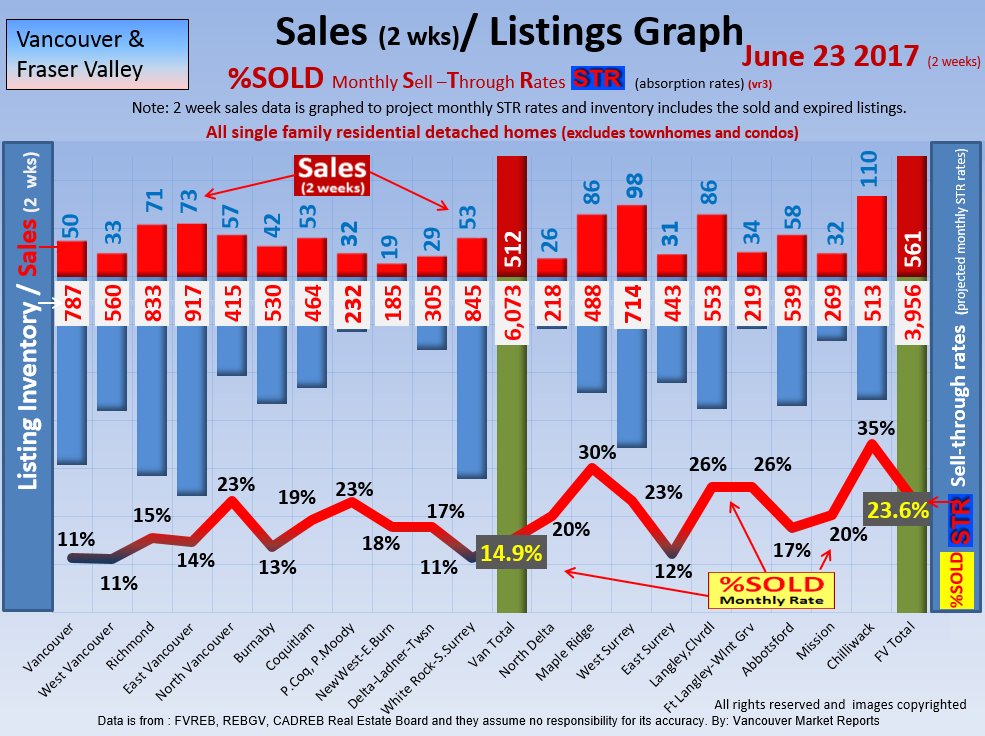
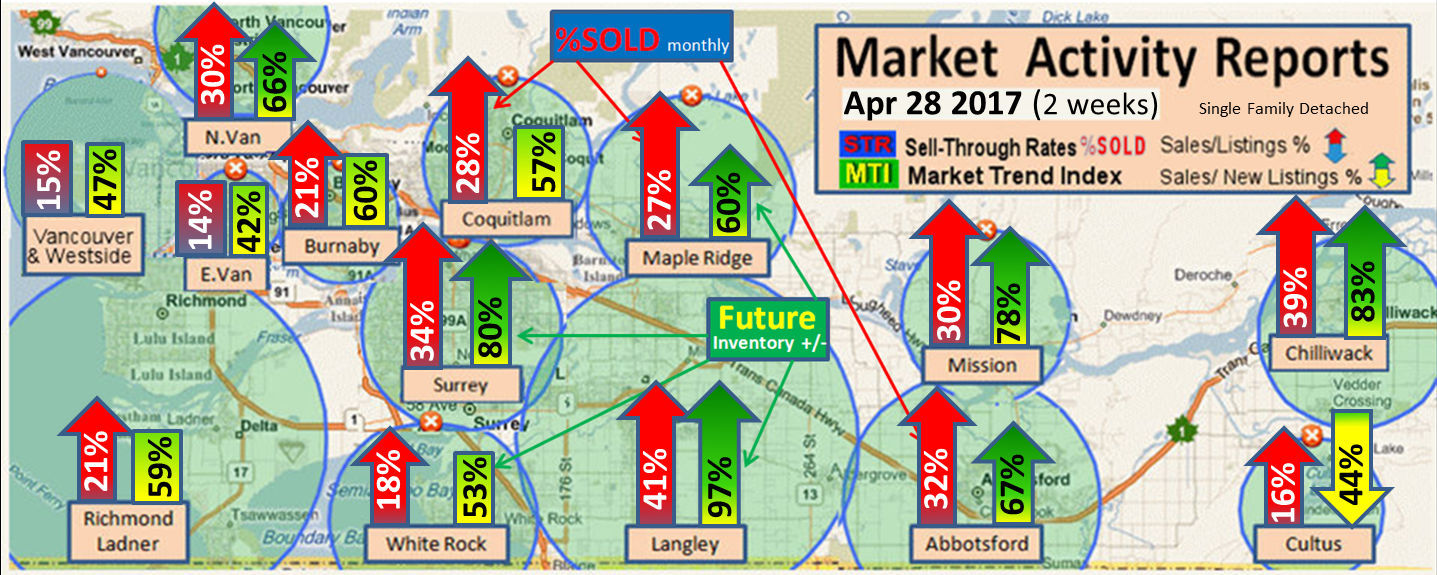
Now do compare the %SOLD rates to the year 2017

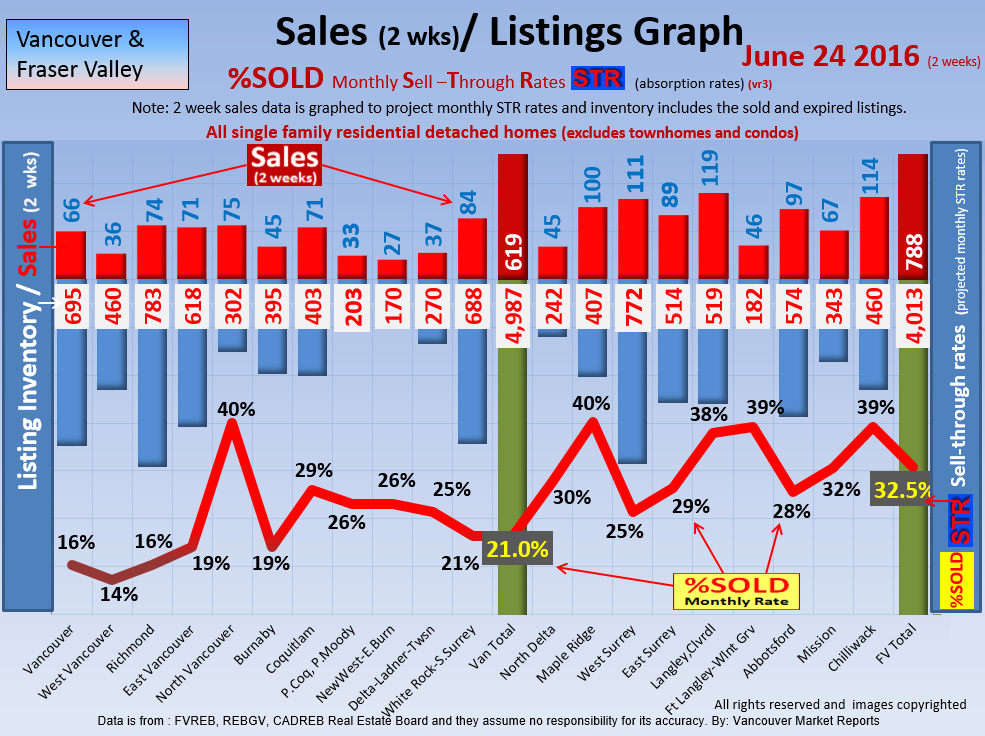
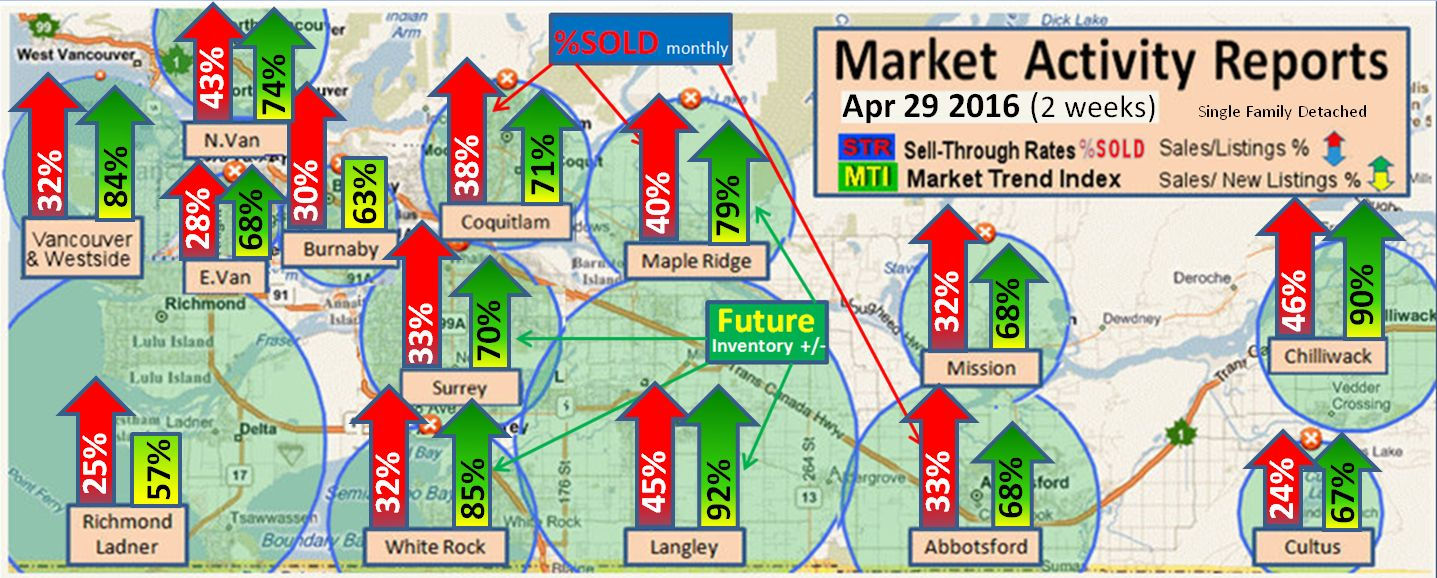
Now do compare the %SOLD rates to the year 2016

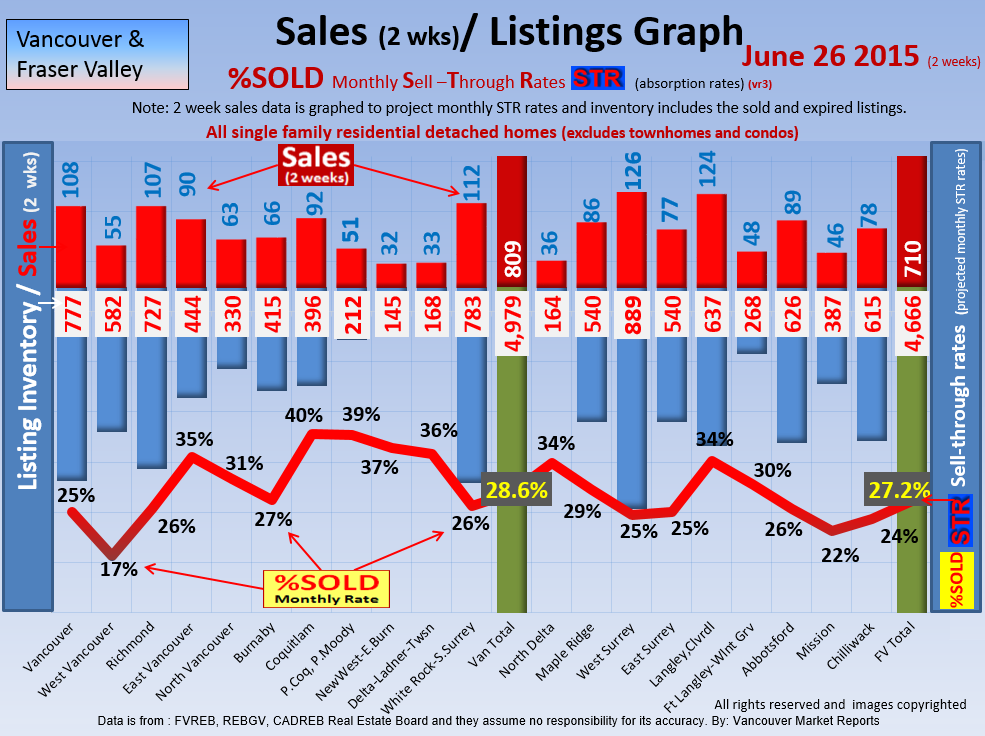
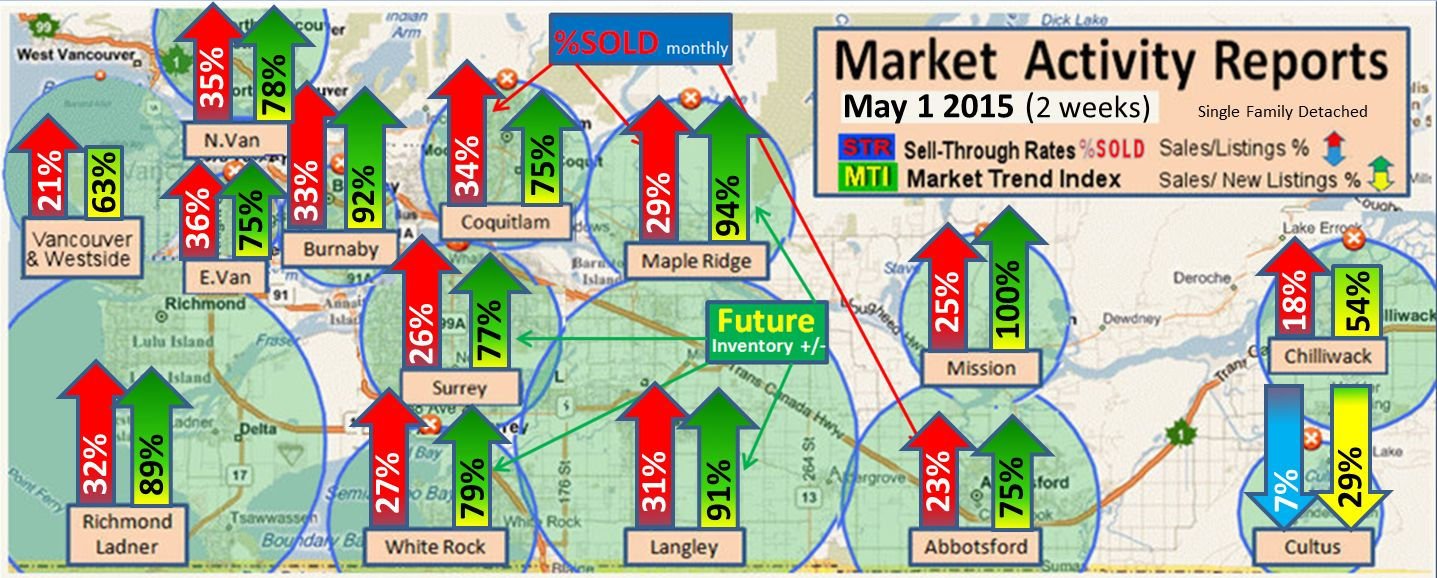
Now do compare the %SOLD rates to the year 2015

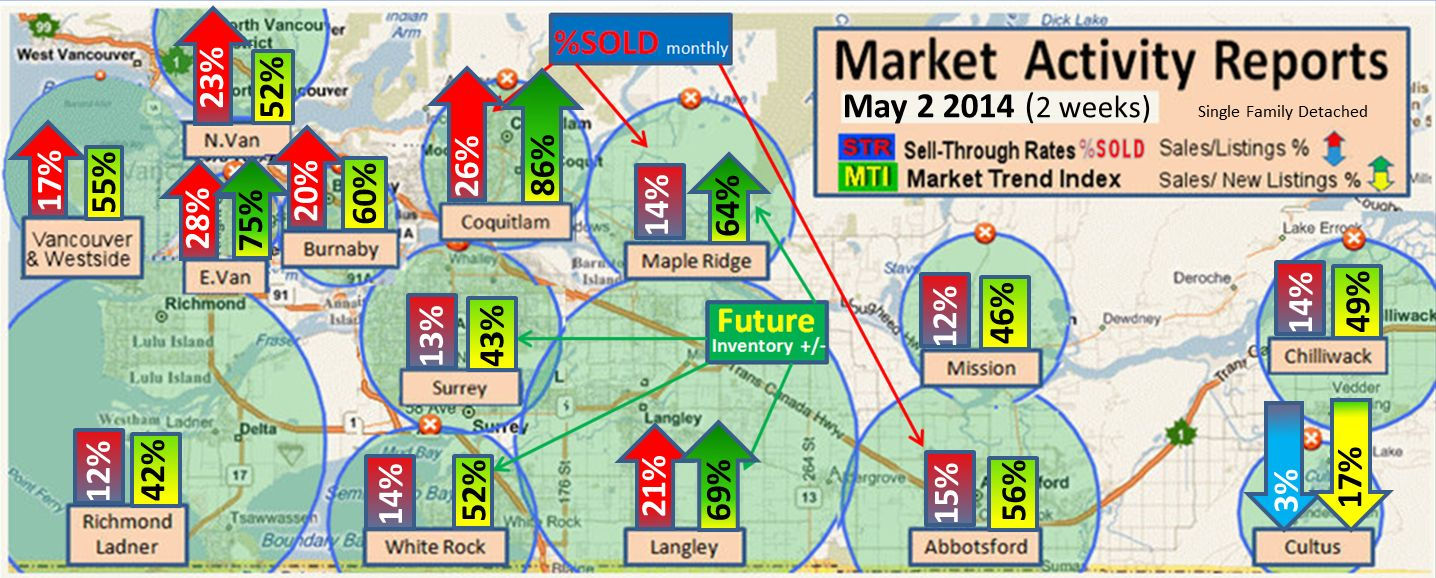
Now do compare the %SOLD rates to the year 2014

Now do compare the %SOLD rates to the year 2013

Now do compare the %SOLD rates to the year 2012


Hello Friends, It’s Bill Coughlin! 

Have these Market Reports helped you?

💰 I’ve spent over $500,000 and 42 years creating the most accurate Real Estate Forecasts for Fraser Valley & Vancouver!

✅ If you find value in these reports — TEXT ME to let me know you want them to continue! 

❓Need help understanding what this means for your property?
📞 Call me for your Free Market Analysis of your home.

📲 Text me now at 778-374-3744. I’m here to help put More Money in Your Pocket!


Real Estate Market Conditions for the Vancouver Area


In the Vancouver area for the Month of September 2026, 28% of the Single Family Home Sold Listings reduced their List Price by an average of $110,009. This compared to August 2026 when 24% reduced their List Price by an average of $124,242.
(Note: the other Two Week Reports ( STR and MTI ) will be more accurate market indicators than this monthly report after the middle of each month)


Real Estate Market Conditions for the Vancouver Area


In the Fraser Valley-Chilliwack area, for the Month of September 2026, 32% of the Single Family Home Sold Listings reduced their List Price by an average of $57,084. This is compared to August 2026 when 35% reduced their List Price by an average of $54,896.
(Note: the other Two Week Reports ( STR and MTI ) will be more accurate market indicators than this monthly report after the middle of each month)


zzz

The Best and Worst Investments in Greater Vancouver()


Year over Year (12months Back): Greater Vancouver Real Estate Markets 
Prices Changes

Updated 2026 June w8cr2r b5a

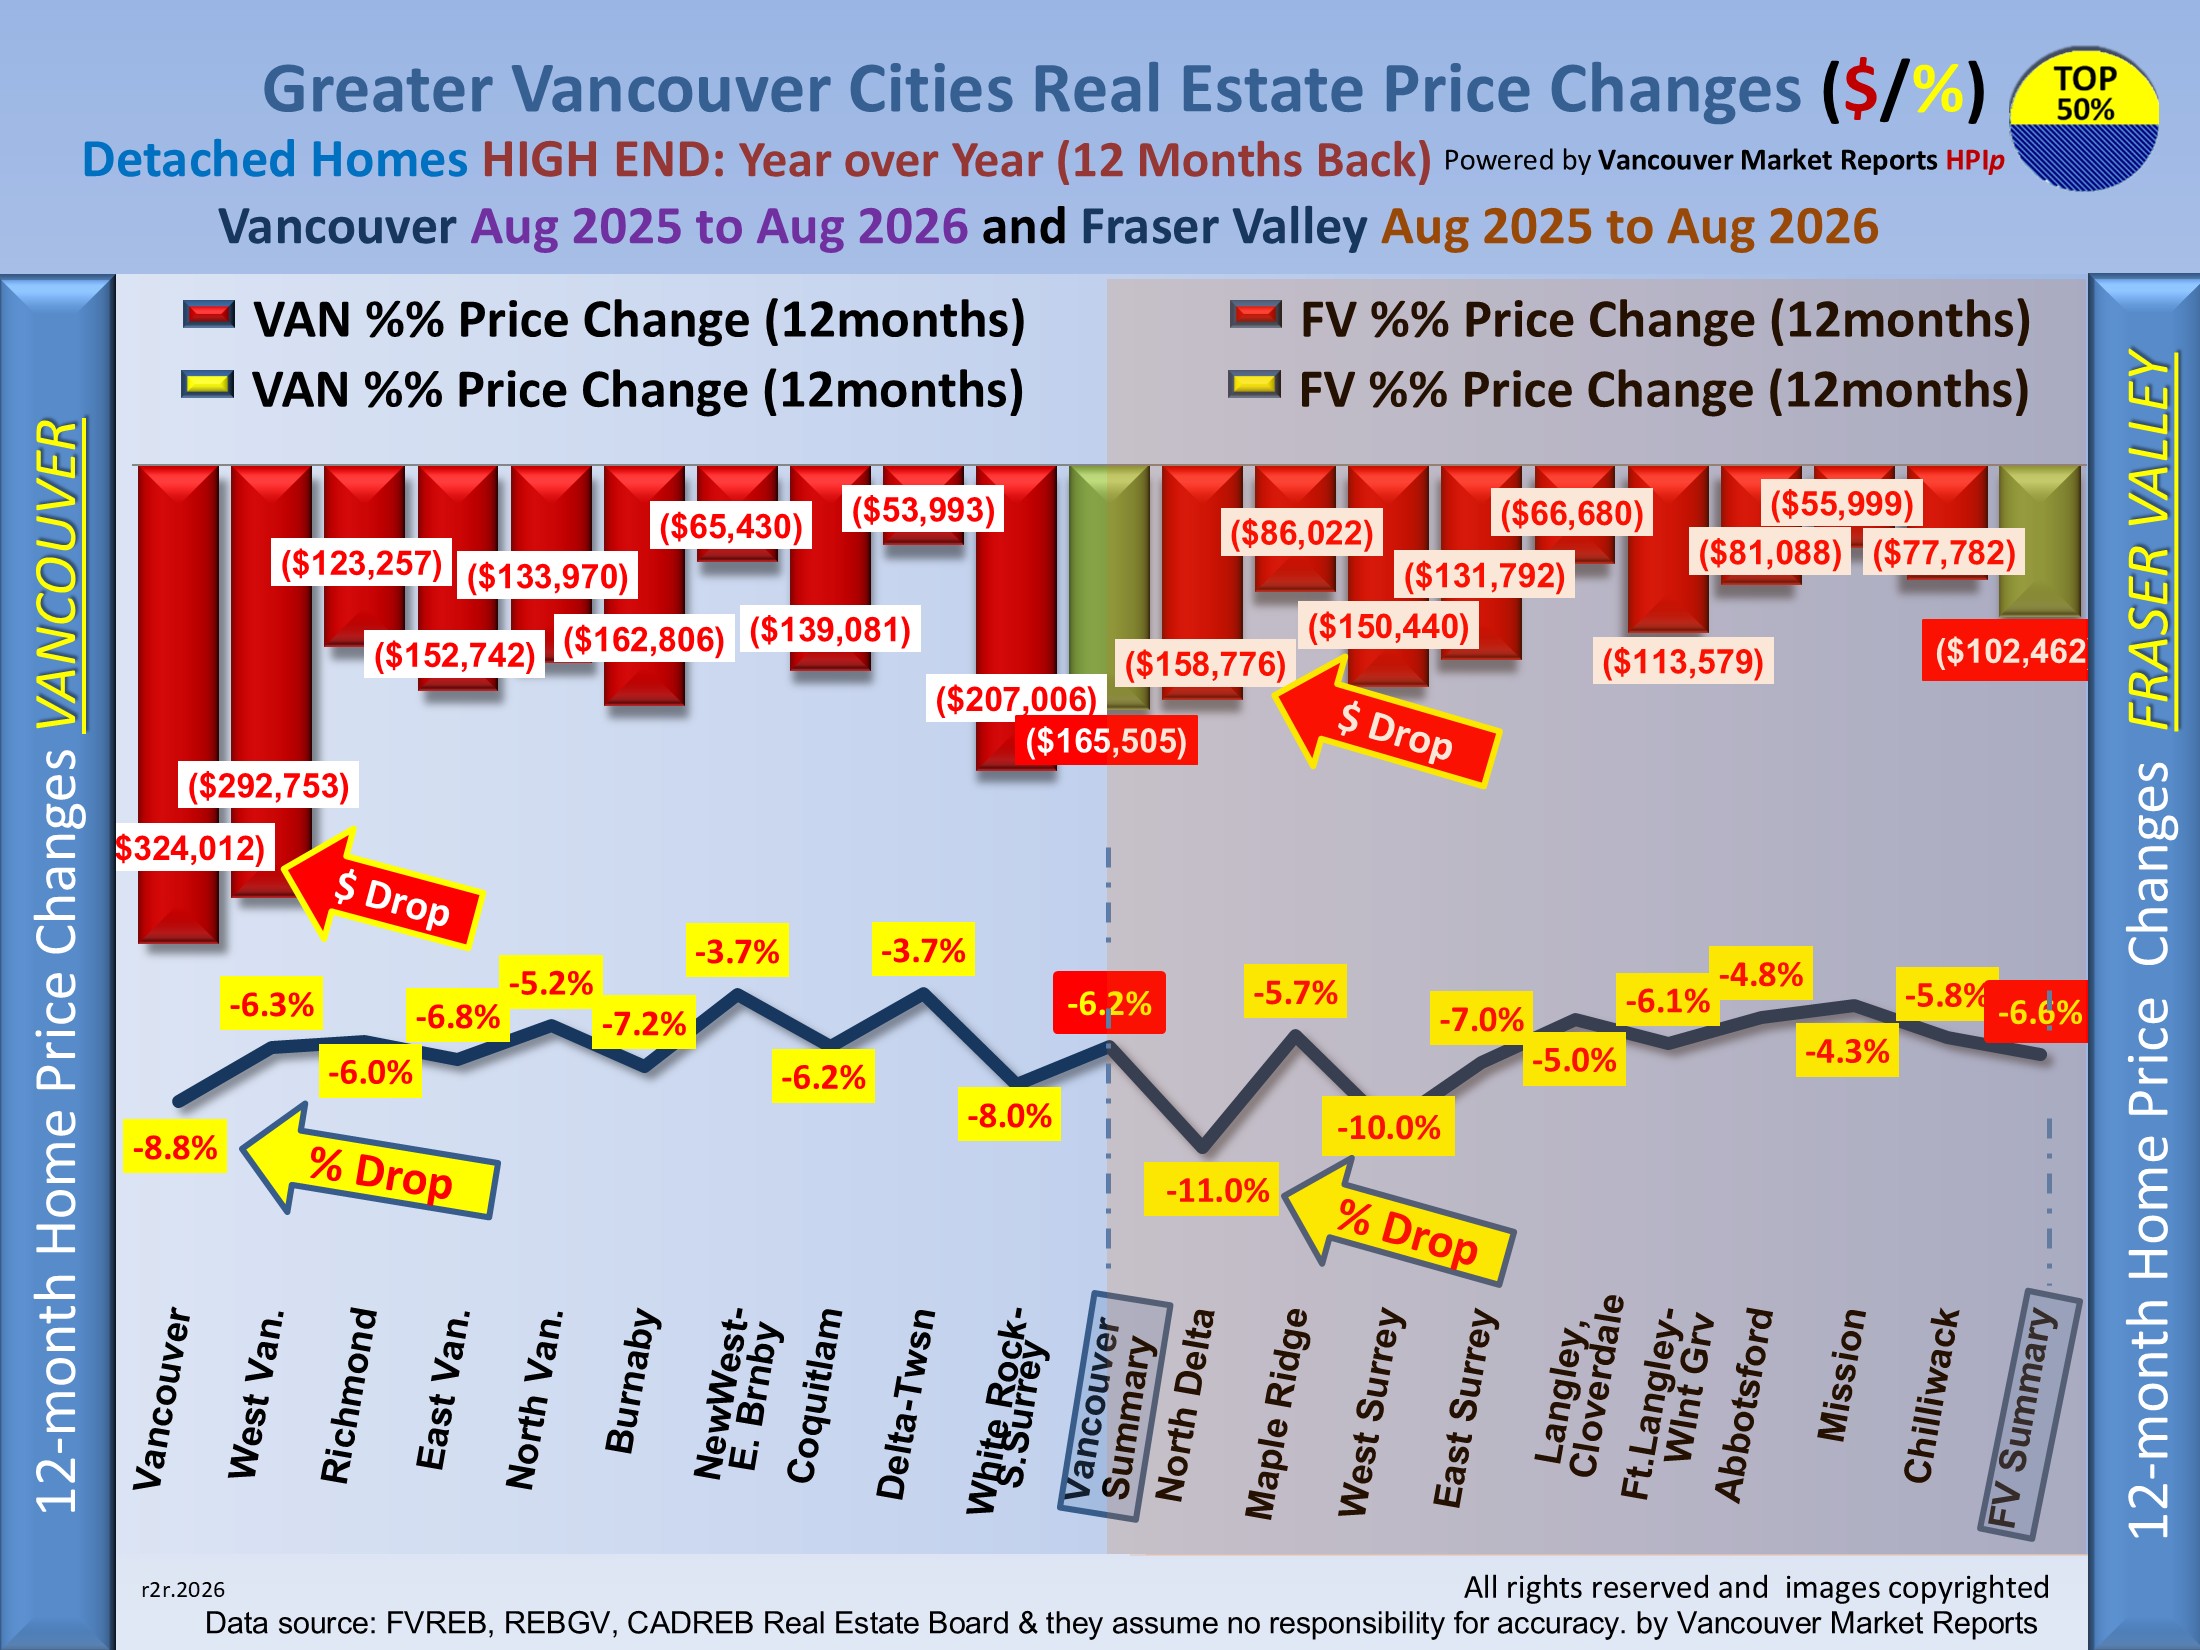
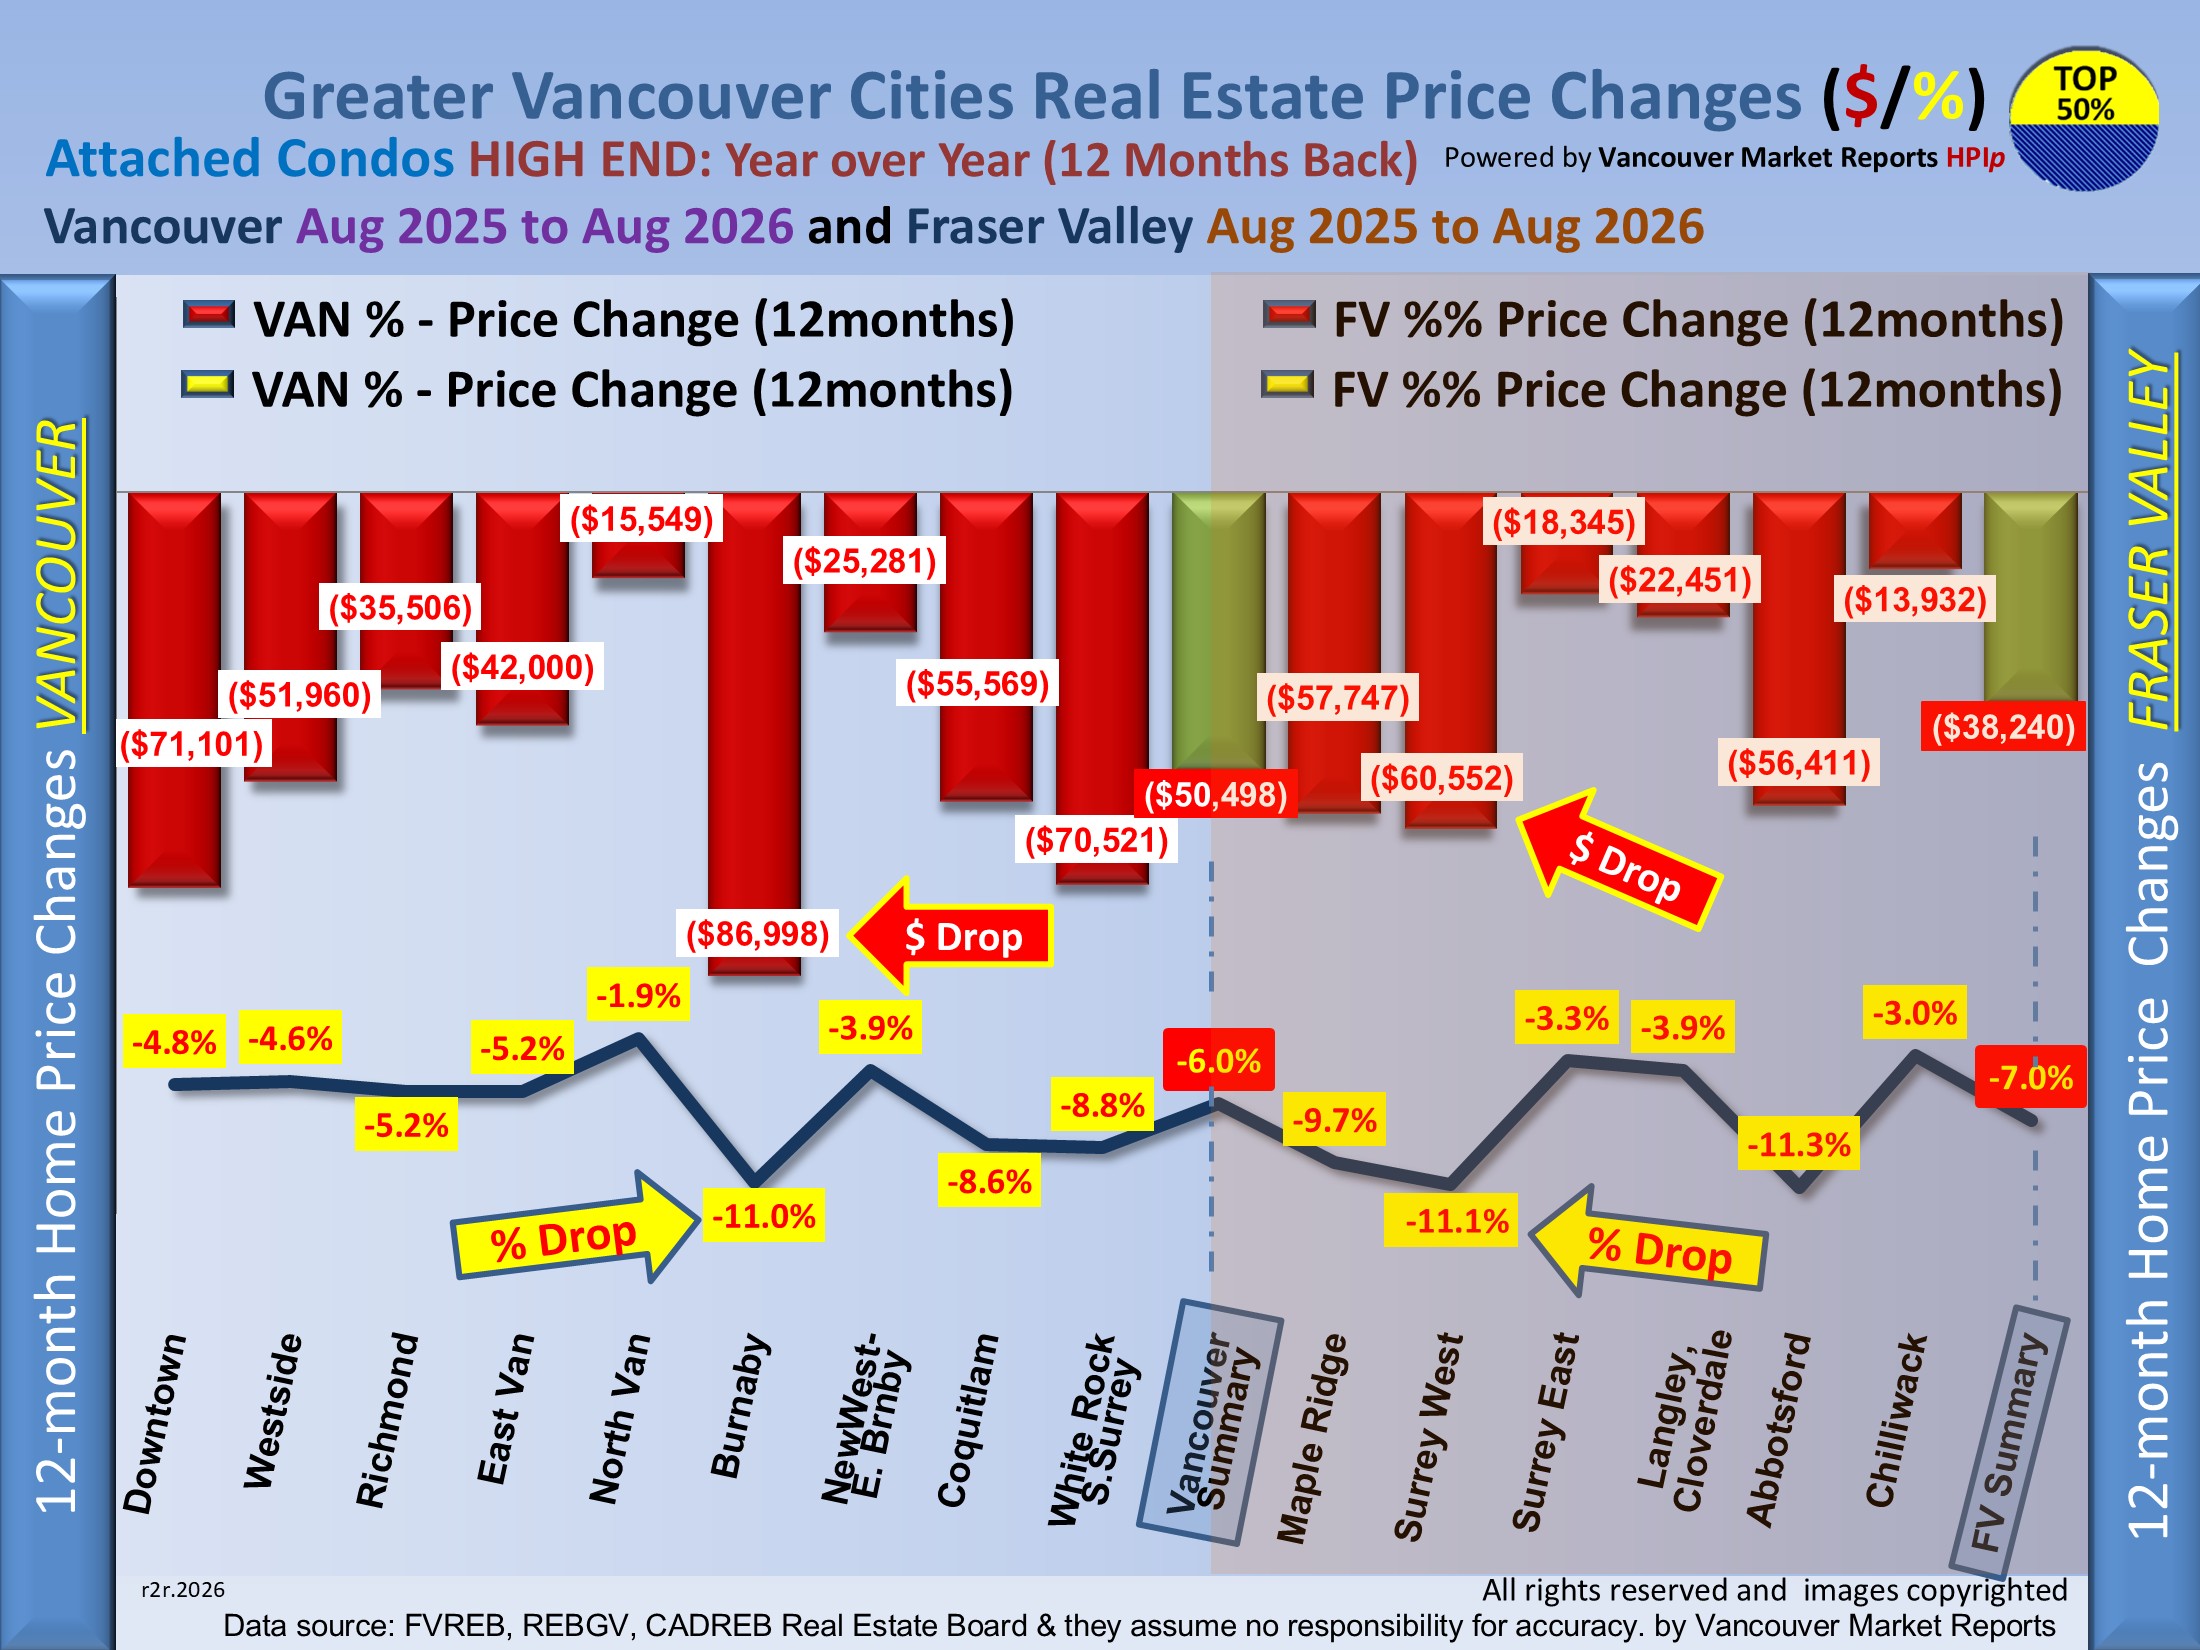
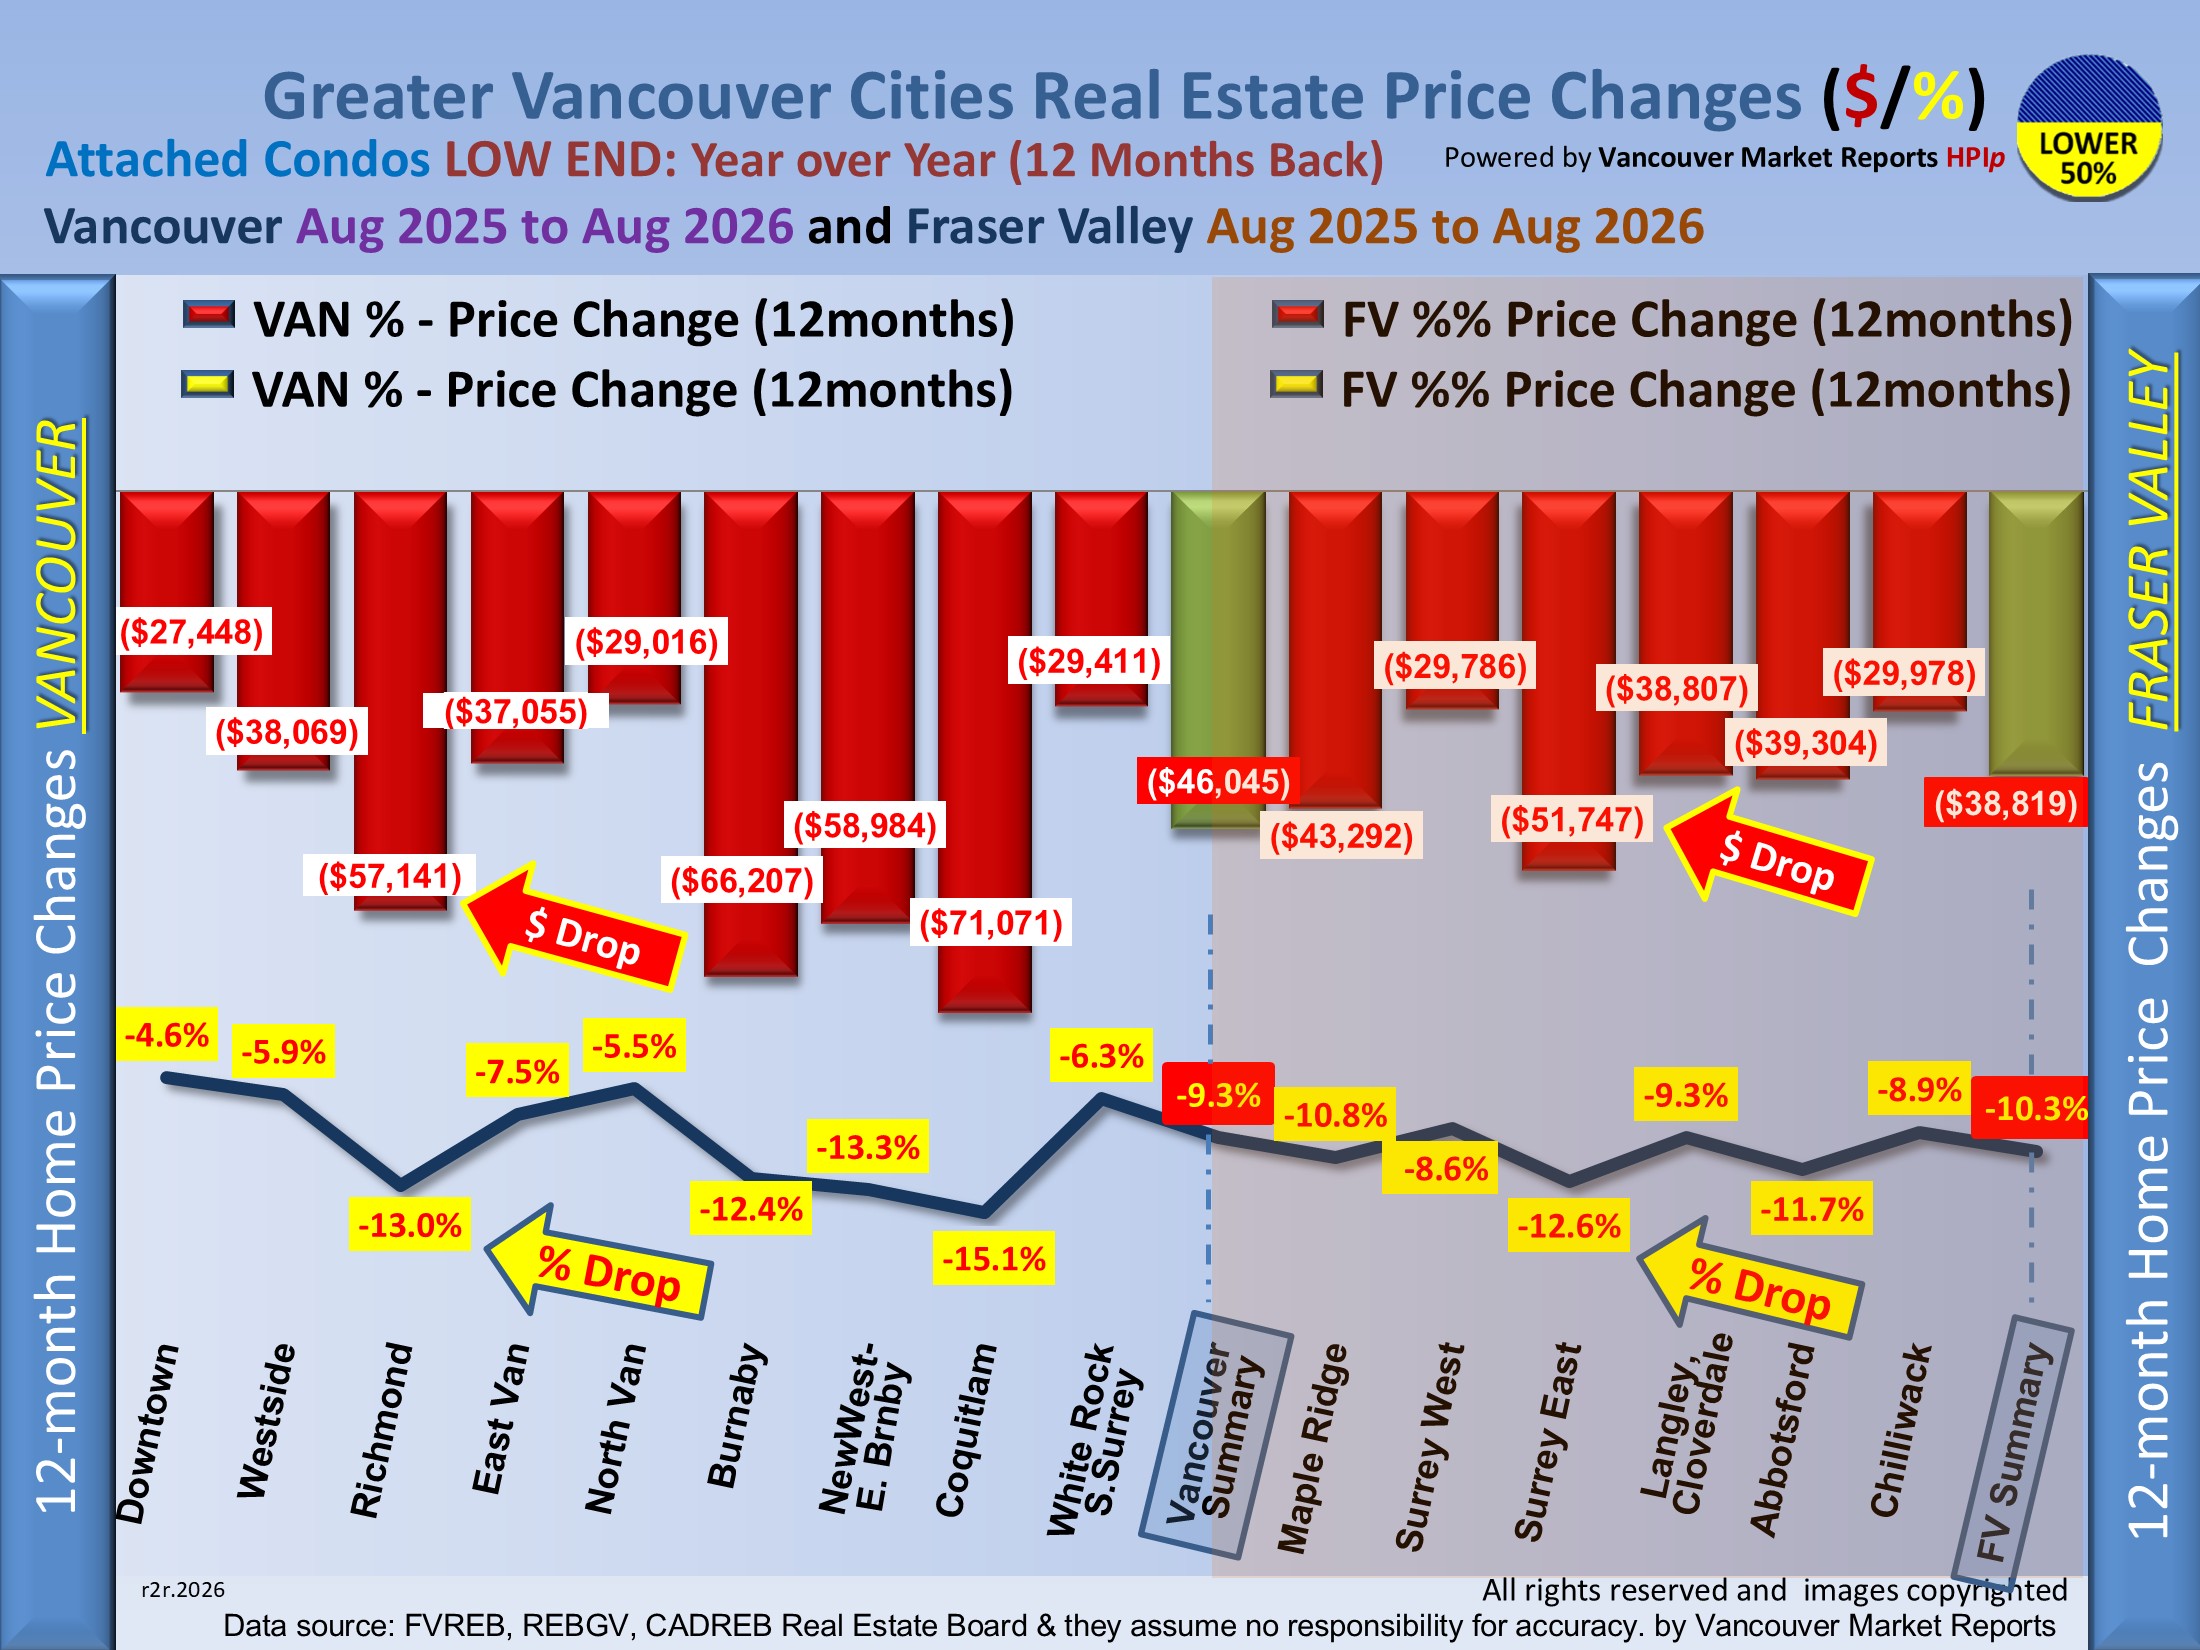
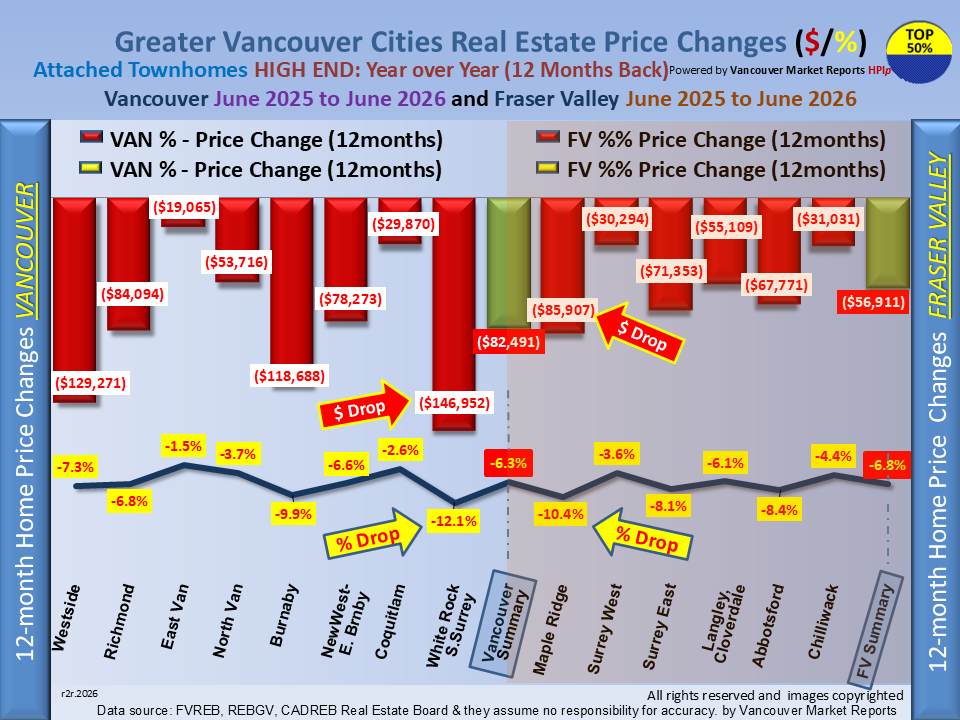
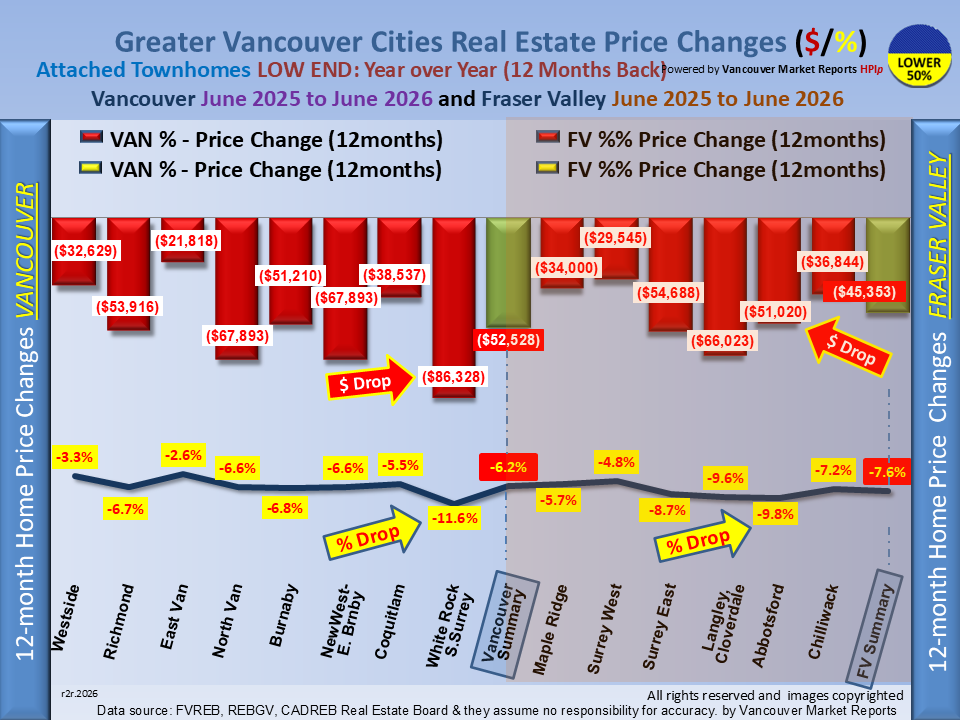
Prices have dropped across most Cities in All Markets!

From the Aug 2025 (12 months of Sales) For Vancouver Detached Homes:

Vancouver is down the most at 8.8%,
NewWest declined JUST 3.7%.

From the Aug 2025 (12 months of Sales) For Fraser Valley Detached Homes:

All cities continue to show a downward trend for average price changes,

 North Delta had the biggest drop at 11.0% 

West Surrey had the 2nd biggest drop at 10.0% 

  and the city with the least drop was Mission at 4.3%. 


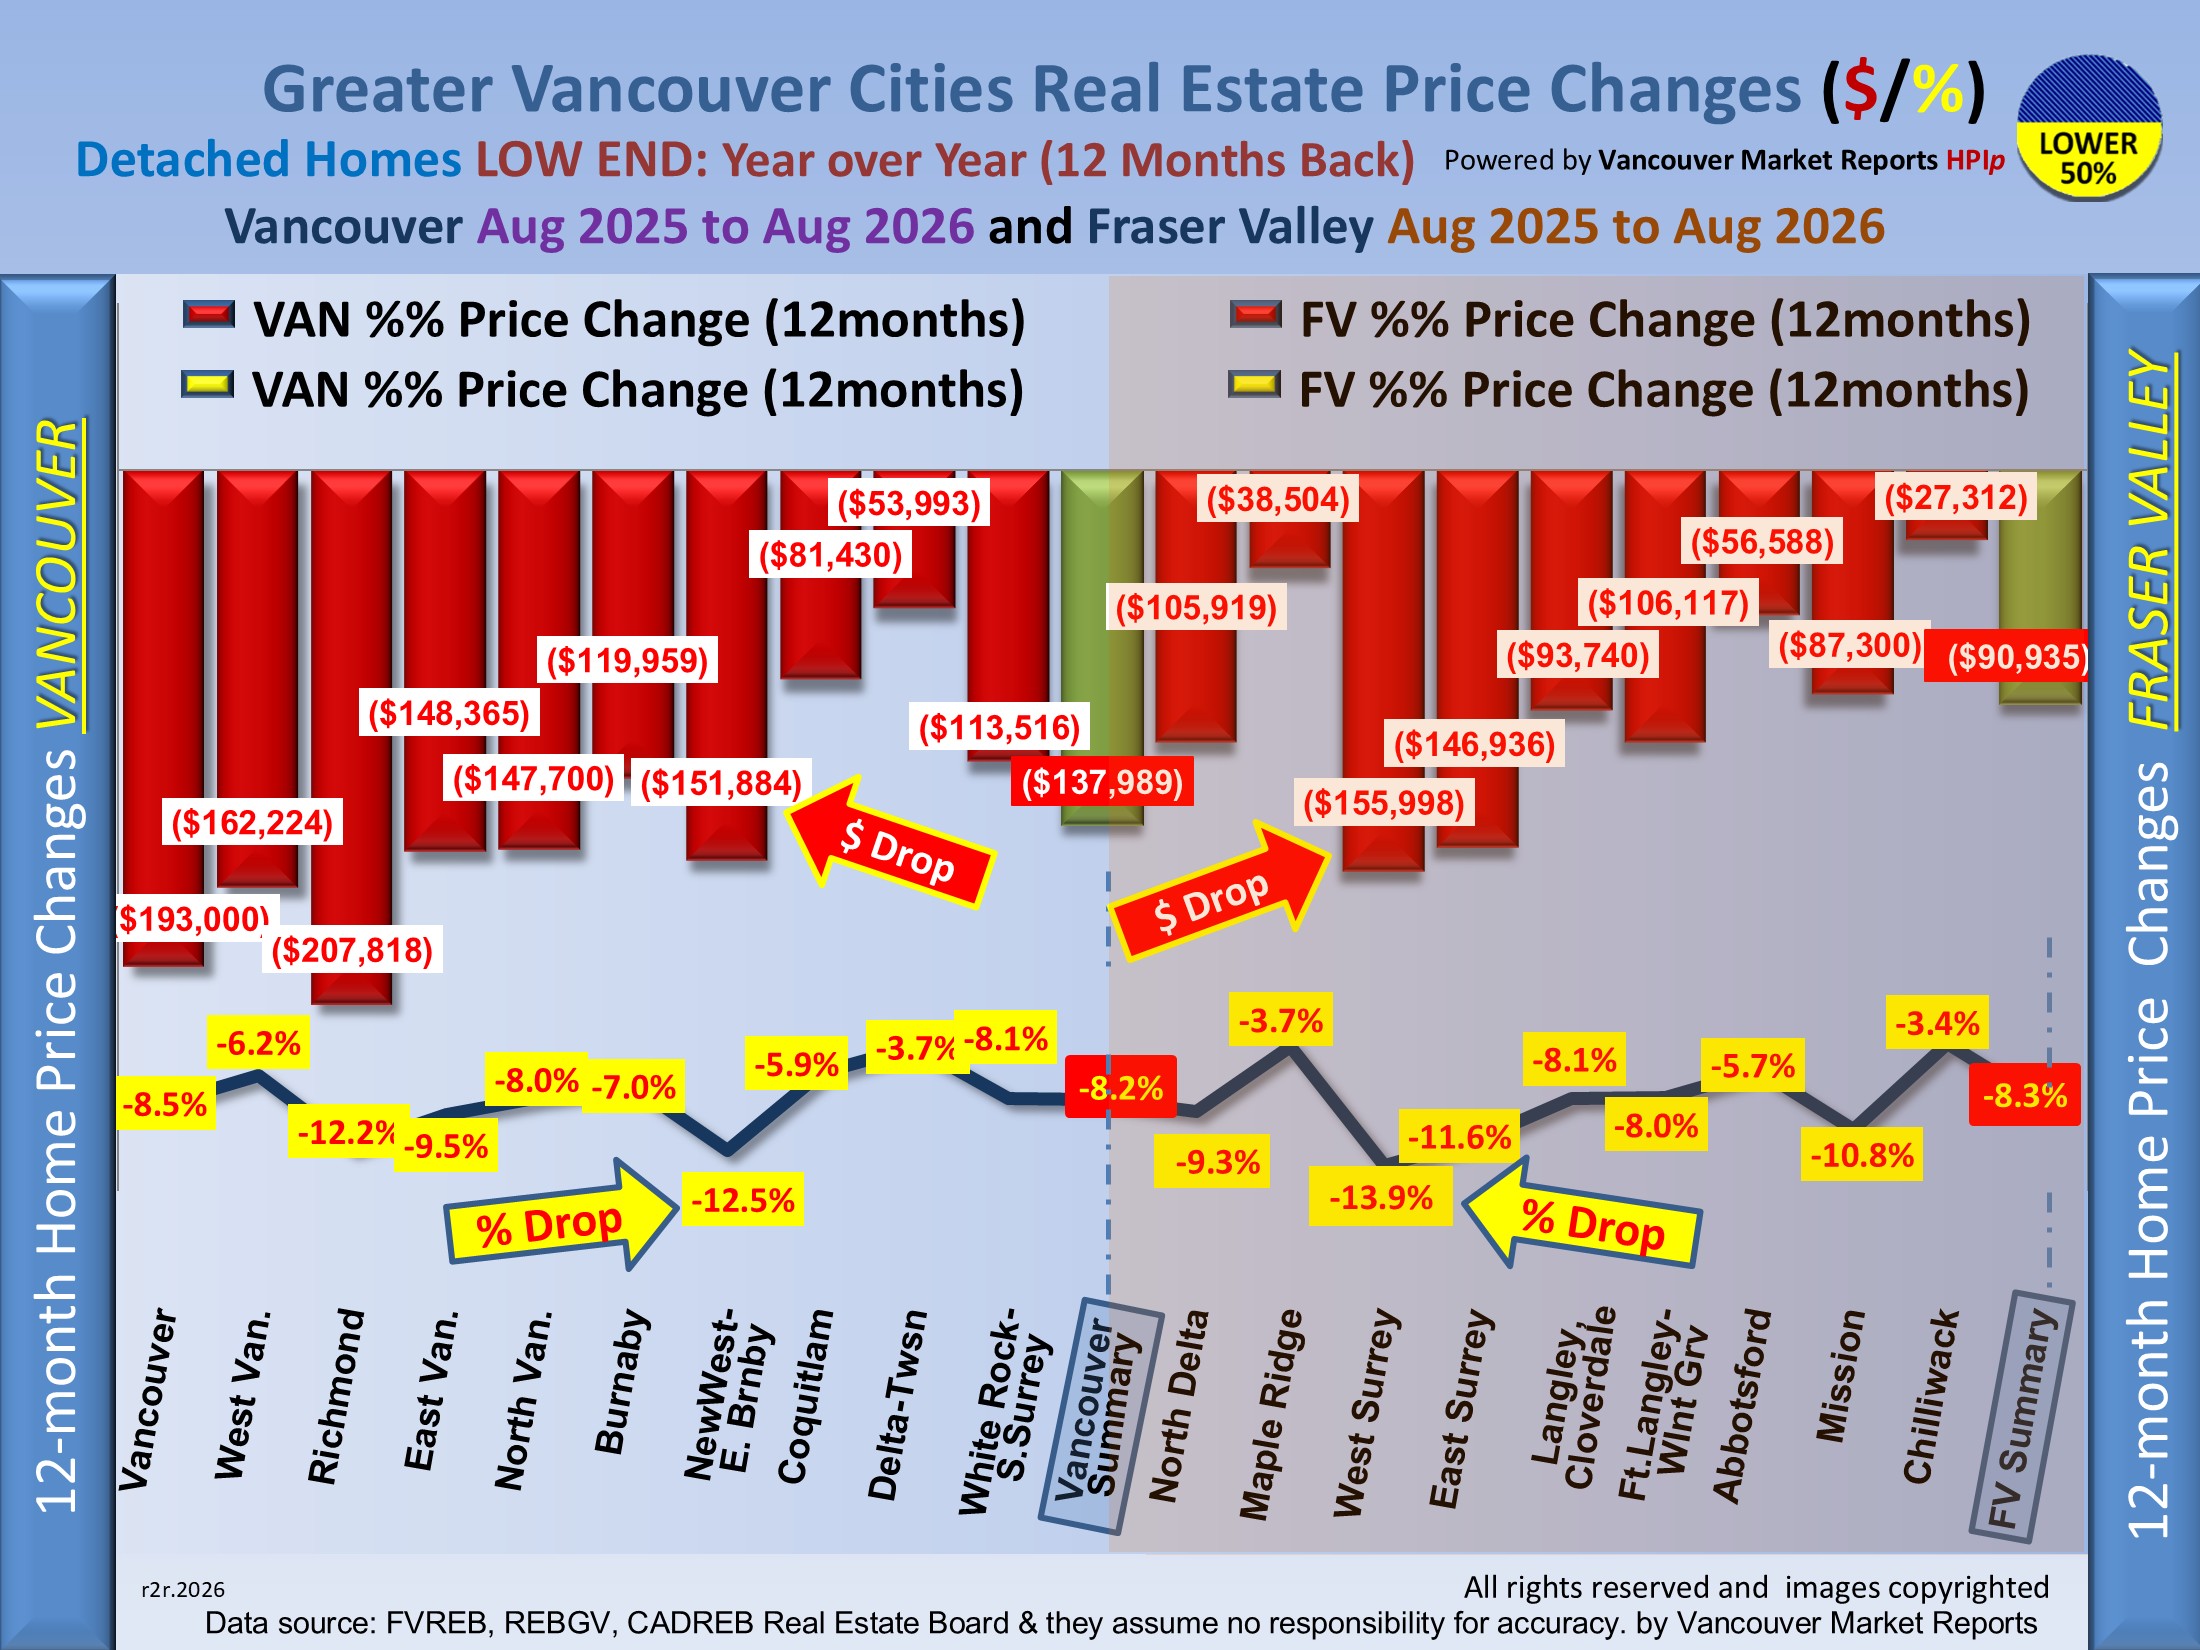
(Click Image to See the difference between the High and Low Markets)


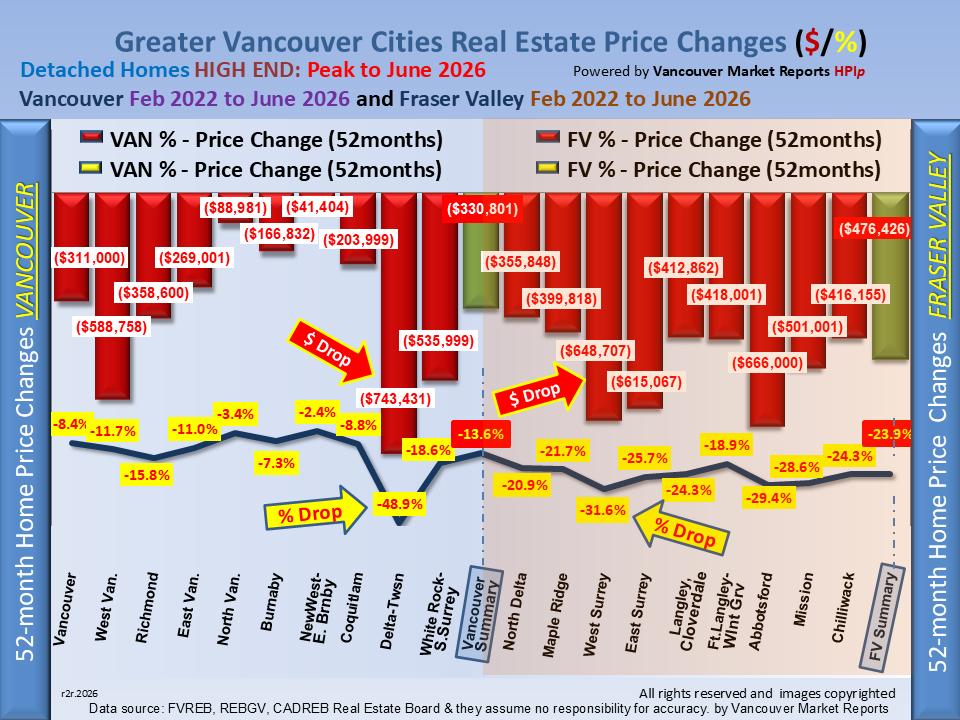
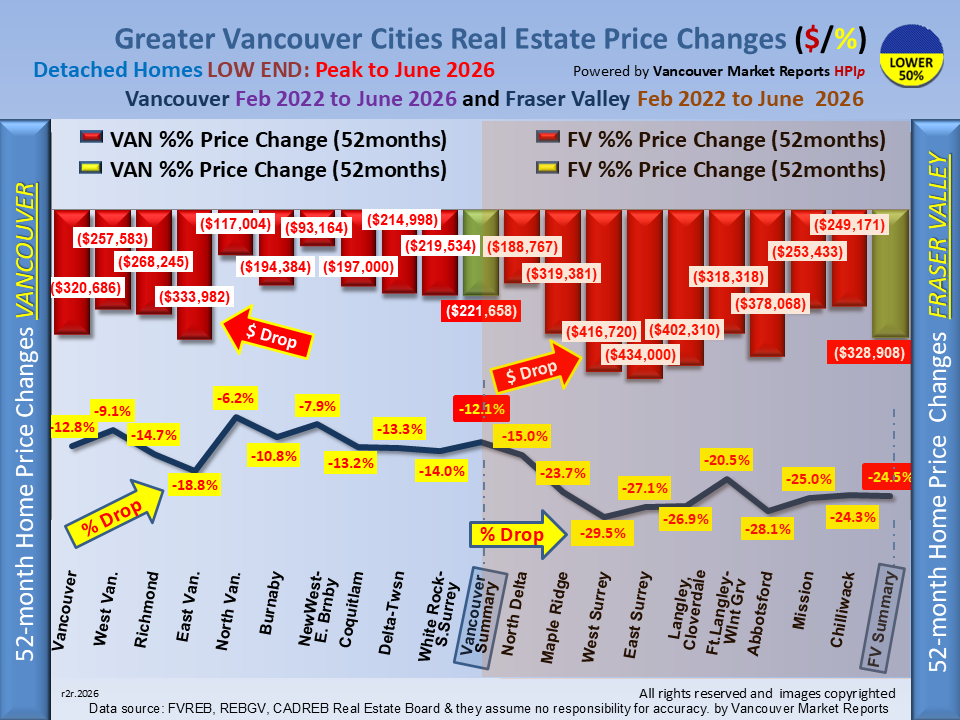
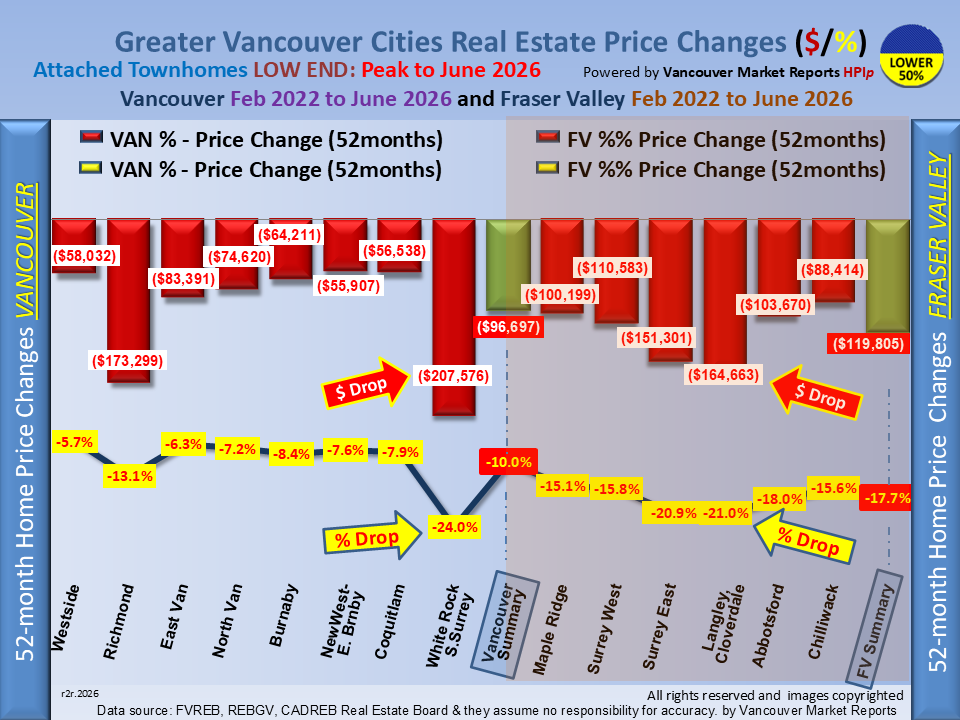
From the Peak in Feb 2022 (52 months of Sales) For Vancouver Detached Homes:

Delta-Twnsn is down the most at 48.9%,
Richmond declined JUST 15.8%.

From the Peak in Feb 2022 (52 months of Sales) For Fraser Valley Detached Homes:

All cities continue to show a downward trend for average price changes,

 West Surrey had the biggest drop at 31.6% 

Abbotsford had the 2nd biggest drop at 29.4% 

Mission's High 50% dropped 28.6% or -$666,000.

  and the city with the least drop was Ft Langley Wlnt Grve at 18.9%.

                                                                                                                                             TOP

 
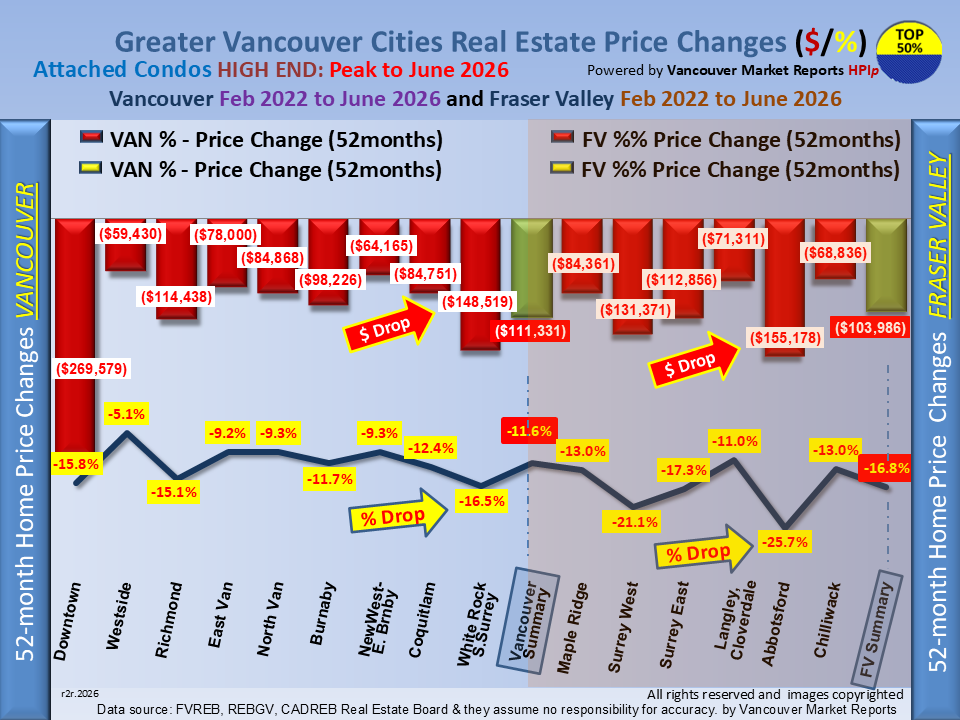
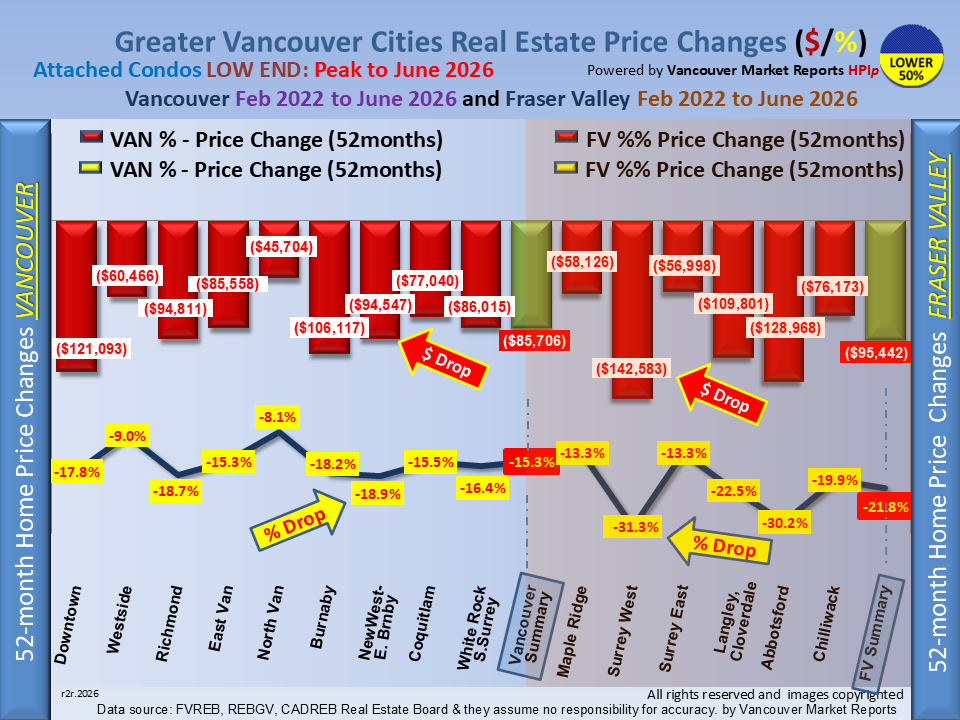
Condos  Attached        High/Low Markets                                                                                                                  TOP

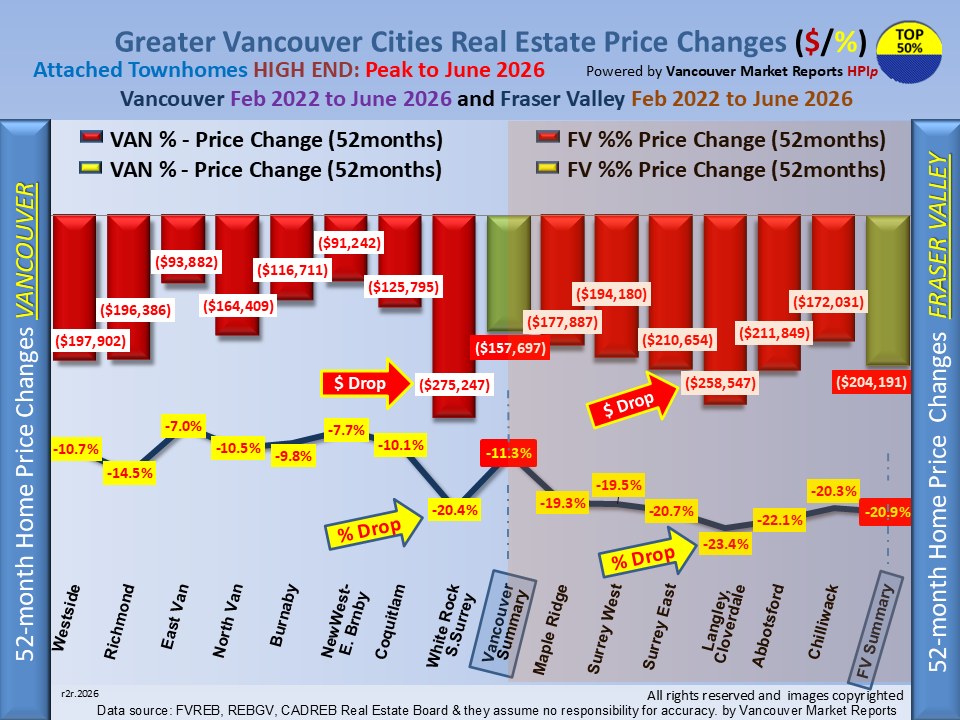
Townhouses  Attached        High/Low Markets                                                                                              TOP


Bill Coughlin
"Realtor and Lifestyle Consultant"


1-778-374-3744            [email protected]

eXp Realty
Independently Owned and Operated                               Key words Real Estate Investments Housing Market Trends and Forecasts for Vancouver Area

See all Markets


Trying to do the math?   STR   Lesson  MTI  Lesson  

Now do compare the %SOLD and the MTI rates to last year!

Now do compare the %SOLD and the MTI rates to year 2022!

Now do compare the %SOLD and the MTI rates to year 2021!

Now do compare the %SOLD and the MTI rates to year 2020!

Now do compare the %SOLD and the MTI rates to year 2019!

Now do compare the %SOLD and the MTI rates to year 2018!

Now do compare the %SOLD and the MTI rates to year 2017!

Now do compare the %SOLD and the MTI rates to year 2016!

Now do compare the %SOLD and the MTI rates to the year 2015

Now do compare the %SOLD and the MTI rates to the year 2014

Now do compare the %SOLD and the MTI rates to the year 2013

Now do compare the %SOLD and the MTI rates to the year 2012

Now do compare the %SOLD and the MTI rates to the year 2011


Archives: Dec 2011

Trying to do the math?   STR   Lesson  MTI  Lesson
How the  STR  and  MTI  rates actually work Click here


Bill Coughlin
"Realtor and Lifestyle Consultant"

778-374-3744 cell        1-888-539-4664 Toll free                     [email protected]

EXP Realty


Vancouver real estate investments


Buy Gold / Silver Today


Hello Friends,
 It’s Bill Coughlin! 

📞 Call me for your Free Market Analysis of your home.

📲 Text me now at
778-374-3744.

I’m here to help put More Money in Your Pocket!


   Social Media VMR e 

Youtube  VMR  
Youtube REMTB  
Youtube CTM     
Youtube BTCD
FB  VMR  
FB  REMTB  
FB  Bill Coughlin   
FB  BTCD
Instagram   REMTB
Instagram    VMR
Tiktok  REMTB 2
X   REMTB
X  Bill Coughlin
Linkedin LNKDN 


 Vancouver.real.estate.investments #温哥华房地产投资

 Real Estate
Market Reports

Index


Hello Friends,
 It’s Bill Coughlin! 

📞 Call me for your Free Market Analysis of your home.

📲 Text me now at
778-374-3744.

I’m here to help put More Money in Your Pocket!

Vancouver Market Share Reports

Market Updates
from the local Experts

BC Election Interviews

How Will this Election

Change the 

Real Estate Market zzz


  Members Login
DiscountOverlist Stats

Adian's Blog: news on Baby Boomers retirement issues  Click here


Bill Coughlin
eXp Realty

call me 1-778-374-3744
Email: [email protected]


   Social Media CTM e 

Youtube  VMR  
Youtube REMTB  
Youtube CTM     
Youtube BTCD
FB  VMR  
FB  REMTB  
FB  Bill Coughlin   
FB  BTCD
Instagram   REMTB
Instagram    VMR
Tiktok  REMTB 2
X   REMTB
X  Bill Coughlin
Linkedin LNKDN 


Number of visits on this page: 28,909. Number of visits on this site: 19,959,405.